

Surveys
Pawtograder’s surveys feature enables instructors to collect structured feedback from students about courses, assignments, teaching methods, and more. Create custom surveys, track response rates in real-time, and export data for analysis.Accessing Survey Management
Navigate to Surveys in the course navigation menu to access the survey management dashboard. Only instructors can create, edit, publish, close, or delete surveys. Graders can open View Responses on a published or closed survey; on a draft row they see the title without a link and a disabled No Actions Available menu.Surveys are controlled by a course feature flag under Course Settings → Feature flags. Turning it off hides the Surveys menu entry for students and staff, but it does not block direct links to survey pages.
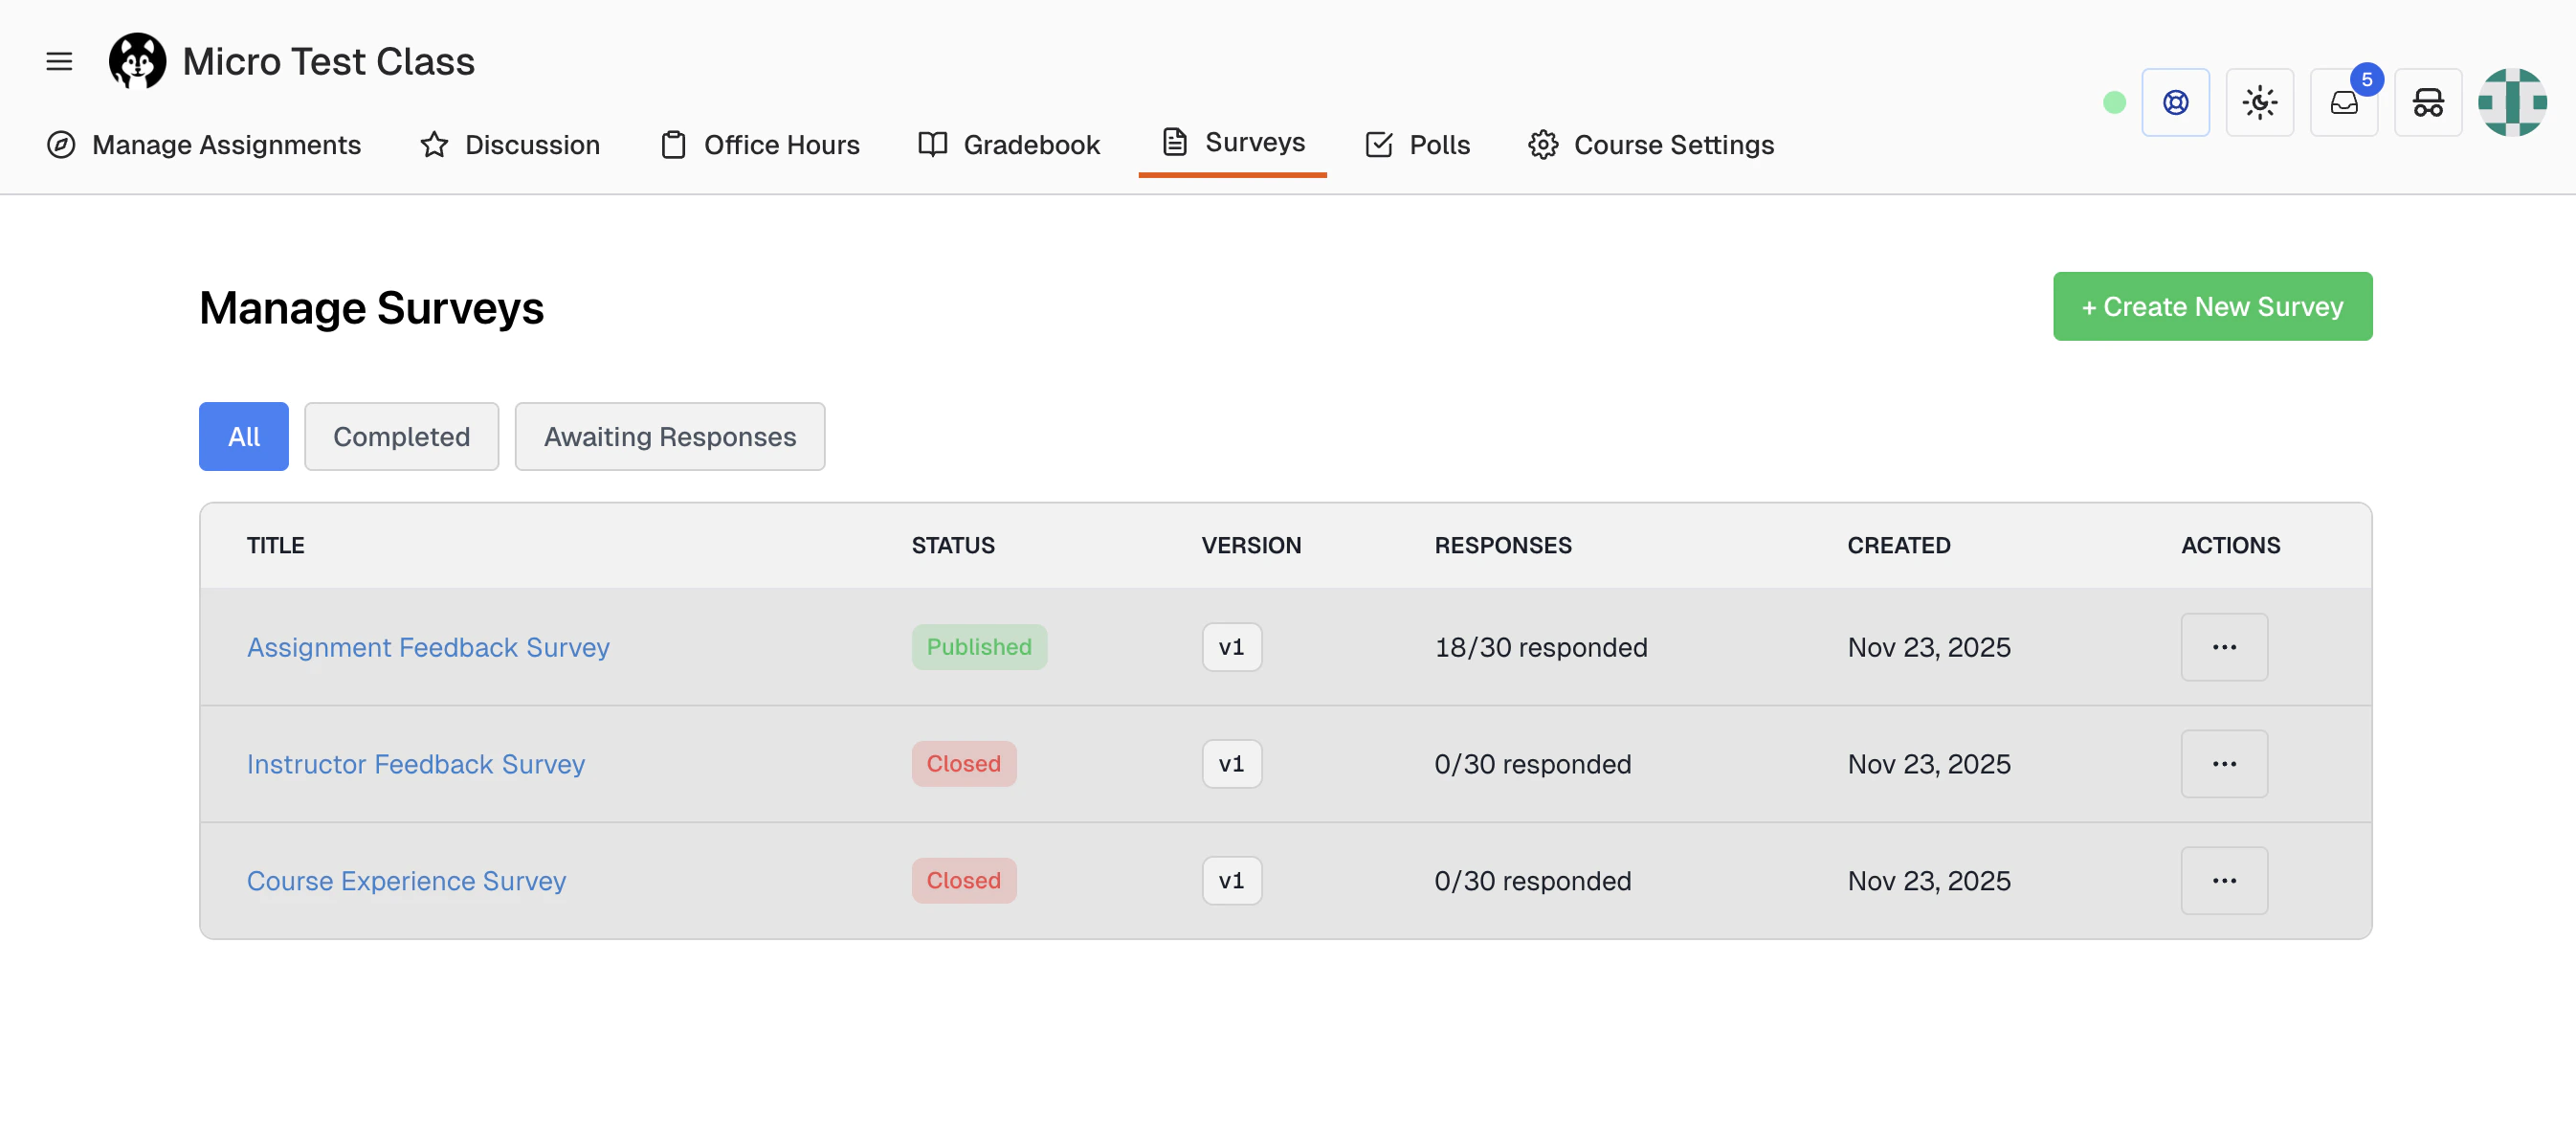
- Title — links to the responses page, or to the editor for a draft
- Status — Draft (yellow), Published (green), or Closed (red)
- Version — a
v1-style badge - Responses —
n/m respondedagainst the number of assigned students, or—for a draft - Created
- Due date
- Linked assignment
- Actions — a ⋯ menu whose entries depend on the survey’s status
Creating a New Survey
Starting from Scratch
- Click the Create New Survey button in the top-right corner
- Enter a survey title (required)
- Add an optional description to provide context for students
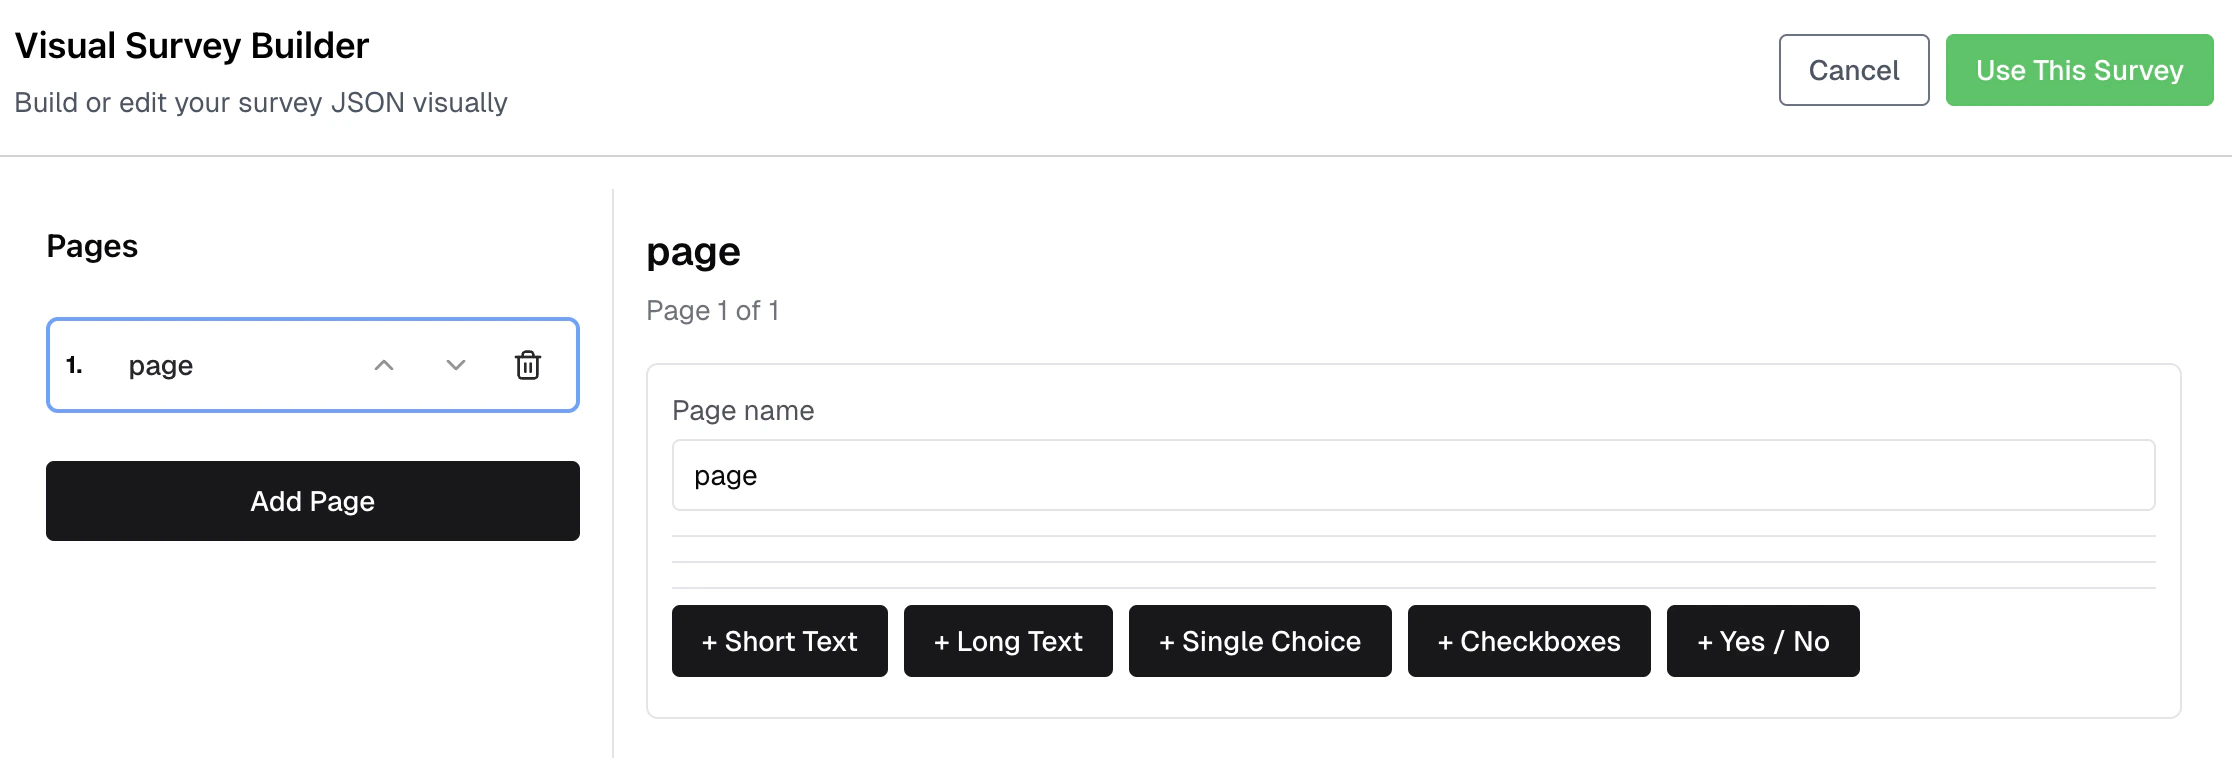
- Click Open Visual Builder to add questions (see Visual Builder section below)
- Configure survey settings (see Survey Settings section below)
- Choose the due date and whether to allow students to edit their responses after submission
- Click Preview as Student to check the survey if needed
- Set Status to either “Draft — saved but hidden from students” or “Published — visible to students (subject to the Available at date above)”
- Click the submit button at the bottom of the form. Its label follows the status you chose: Publish Survey or Save Draft
Using the Template Library
Save time by starting with a pre-built survey template:- Click the Create New Survey button
- Click Browse Templates
- Search or filter templates by:
- All Templates or My Templates
- Visibility: Class-Only or Global
- Search by name or description keywords
- Click Preview to see the full survey before using
- Click Clone to create a new survey with the template’s questions pre-filled
- Customize as needed and publish
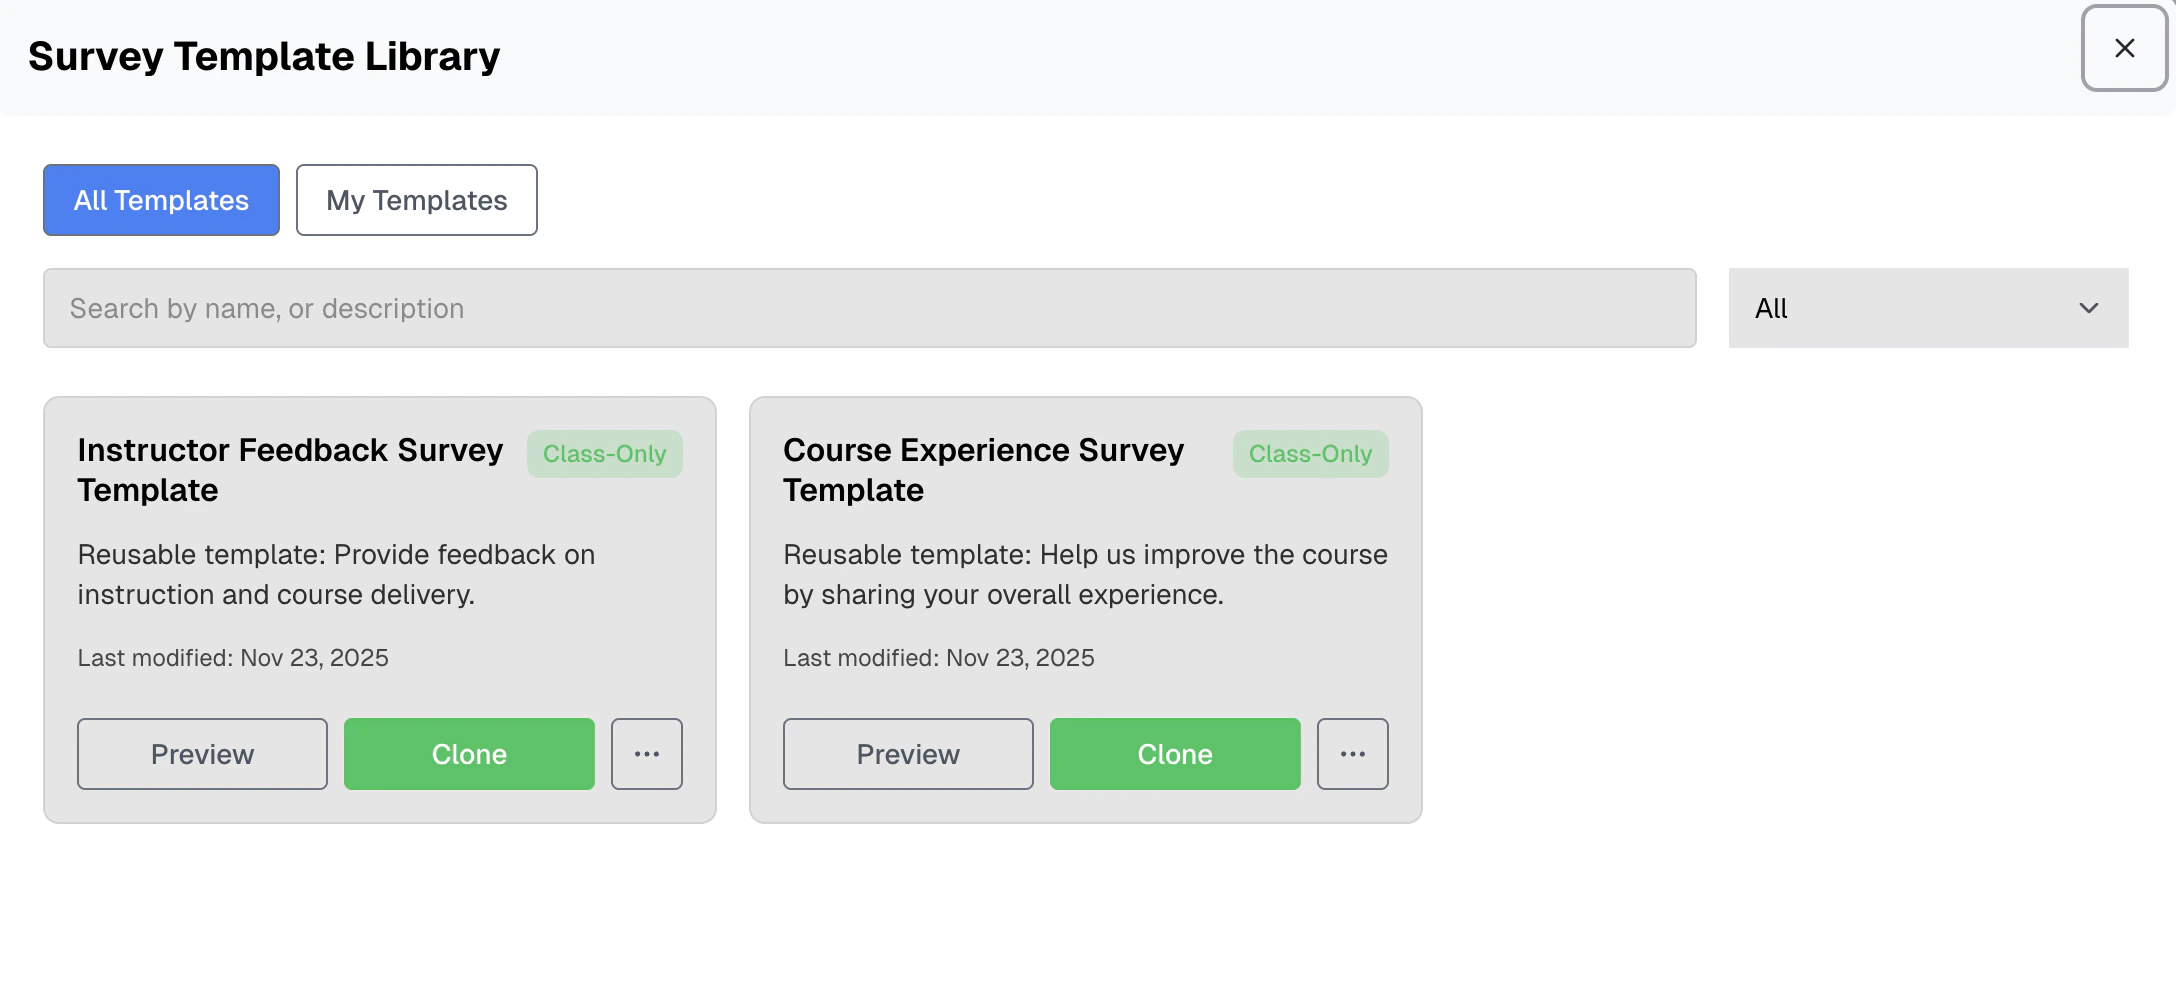
- Class-Only: Templates visible only within your course
- Global: Templates shared across all courses in the platform
Visual Builder
The visual builder uses SurveyJS, providing access to a wide variety of question types.Supported Question Types
- Short Text: Short-line text area for concise responses
- Long Text: Multi-line text areas for detailed responses
- Single Choice: Radio buttons to select one option from a list
- Checkboxes: Multiple select boxes allowing students to choose one or more options
- Yes / No: Binary question with two clear options for simple confirmations
Building Your Survey
- Name the page if needed (optional, helps organize multi-page surveys)
- Click a question type button to add a new question (+ Short Text, + Long Text, etc.)
- Enter the question name (this becomes the column header in response exports)
- Add an optional description to provide context for students
- Mark questions as required using the Required toggle
- For choice-based questions, add and reorder answer options
- Use the arrow buttons (↑ ↓) to reorder questions
- Click the trash icon to delete a question
- Click Use This Survey when finished
Multi-Page Surveys
For longer surveys, organize questions across multiple pages:- Click Add Page in the left sidebar to create a new page
- Name each page to help students understand their progress
- Use the arrow buttons to reorder pages
- Delete a page by clicking the trash icon (cannot delete the last remaining page)
- Click on any page name to switch between pages while editing
Configuring Question Options
For Single Choice and Checkboxes:- Click Add choice to add new options
- Enter the value for each choice
- Use the arrow buttons to reorder choices
- Click ✕ to remove a choice
- Customize the True label (default: “Yes”)
- Customize the False label (default: “No”)
Survey JSON Editor
Advanced users may directly modify the SurveyJS configuration when creating a new survey. Use the visual builder first, then fine-tune in JSON mode if needed.- The JSON textarea shows the raw SurveyJS configuration
- Click Validate JSON to check for syntax errors before saving
- Changes in the Visual Builder automatically update the JSON
The JSON editor is for advanced users familiar with the SurveyJS JSON format. Most users should use the Visual Builder instead.
Previewing Your Survey
Before publishing, preview how students will see your survey:- Click Show Preview in the preview section
- A modal displays the survey exactly as students will experience it
- Test navigation between pages (for multi-page surveys)
- Verify question types and options display correctly
- Close the preview when satisfied
Survey Settings
Status Options
Draft
- Survey is not visible to students
- Allows you to work on the survey without time pressure
- No responses can be submitted
- Can be edited freely without affecting existing data
Published
- Survey becomes visible to students immediately (or at the configured Available At time)
- Students can begin submitting responses
- Due date validation ensures deadline is in the future
- Editing published surveys is possible but use caution (see Editing Published Surveys below)
Closed
Close a published survey from the ⋯ menu on its dashboard row. Closing is the only action that stops responses:- Every new or edited response is rejected while the survey is not published, including from a student who still has the form open
- The survey disappears from the student Surveys page
- You and your graders keep full access to the responses and analytics
Due Date Configuration
- Click the date/time picker in the survey form
- Select a date and time for the survey deadline
- The system converts to your configured course time zone (see Course Settings)
You can configure your course’s default time zone in Course Settings. All dates and times throughout Pawtograder (including survey deadlines) are displayed in the configured course time zone. The default is America/New_York (Eastern Time).
Available At Configuration
Control when a survey becomes visible to students using the Available At field:- Leave empty to make the survey visible immediately upon publishing
- Set a future date/time to schedule when the survey becomes available
- The survey remains hidden from students until the specified date/time
The Available At date must be before the Due Date. Students cannot access the survey before the availability time, even if it is published.
Response Editing Control
Toggle Allow Response Editing to control whether students can modify their submissions. The form summarizes it as: “When on, changes auto-save. When off, a student’s first submission is final.” Enabled:- Answers autosave as the student works, so a student can close the page and come back to a partly finished survey
- After submitting, the student sees a green banner reading “You can edit your response since editing is allowed for this survey.” and can submit again
- Each re-submission updates the recorded submission time
- Nothing is saved until the student clicks Complete, so a student who closes the page loses their answers
- After submitting, the student sees a yellow banner reading “This survey has been submitted and cannot be edited.” and the survey renders read-only
- The original submission time is preserved
Linking Surveys to Assignments
You can optionally link a survey to a specific assignment. When linked, students see the survey status banner on their submission page, making it easy to complete assignment-related feedback.- In the survey form, select an assignment from the Link to Assignment dropdown
- The survey appears on the assignment’s submission page for students
- The banner shows whether the survey is pending, completed, or overdue
- Students can quickly access and complete the survey from their submission view
Survey Assignment
Control which students can access and respond to your survey: Assign to all students (default)- All enrolled students in the course can see and respond to the survey
- Response rate is calculated against every student whose enrollment is still active; a student marked Dropped is not counted
- Best for course-wide feedback or evaluations
- Select Assign to specific students option
- Click Select Students to open the student picker
- Search for students by name
- Check the boxes next to students you want to include
- Click Confirm to save your selection
Peer Feedback Surveys
Peer feedback surveys allow students to provide constructive feedback about their teammates in group projects. No templates ship with Pawtograder: a fresh course starts with an empty Template Library, and templates appear there only when an instructor saves one or when the instance was populated with the sample library. If your Template Library was seeded, it includes a Peer Feedback Survey template.Current Implementation
Peer feedback surveys use the Assign to specific students assignment mode. The instructor assigns the survey to students who need to provide feedback, and responses are collected like any other survey.The current implementation does not include automated peer-to-peer assignment (e.g., automatically assigning Student A to review Student B). Instructors manually assign surveys to students who should provide feedback. Future versions may include automated peer assignment features.
Peer Feedback Template Structure
The seeded peer feedback template includes the following questions, which you can customize for your course: Rating Questions (1-5 scale):- Overall contribution to the project
- Communication effectiveness with the group
- Reliability in completing assigned tasks on time
- Collaboration and supportiveness
- Quality of work produced
- Team member strengths (Technical skills, Problem-solving, Communication, Leadership, Time management, Creativity, Attention to detail, Helping others)
- What did this team member do well?
- What could this team member improve on?
- Additional comments (optional)
Using the Peer Feedback Template
- Click Create New Survey
- Click Browse Templates
- Search for “Peer Feedback Survey”
- Click Clone to use the template
- Customize questions as needed for your course context
- Use Assign to specific students to assign to group members
- Publish when ready
Viewing Peer Feedback Responses
Peer feedback responses are visible only to instructors and graders. Students can only see their own submitted responses, not feedback others have provided. To review peer feedback:- Navigate to the survey’s View Responses page
- Use filters to focus on specific questions or date ranges
- Export to CSV for detailed analysis or grade calculations
Group Mentors and Analytics
Assigning Mentors to Groups
For group assignments, you can assign mentors (instructors or graders) to student groups. This enables mentor-specific views in survey analytics and enables targeted feedback collection.- Navigate to the assignment’s Groups page
- In the groups table, find the Mentor column
- Select a mentor from the dropdown for each group
- The mentor assignment is saved automatically
- View analytics for only their assigned groups
- See aggregated survey responses from their groups
- Track group health metrics and alerts
- Provide targeted support and intervention when needed
- Distribute workload among TAs for large courses
- Assign specialized mentors based on project topics
- Enable targeted feedback collection from specific mentor-group pairings
- Track mentor effectiveness through group-specific survey analytics
Survey Analytics
Pawtograder provides comprehensive analytics for survey responses, including statistical analysis and visualizations broken down by groups, mentors, and sections.Accessing Analytics
Navigate to View Responses on any published or closed survey to access the analytics dashboard. The analytics panel appears only when the survey contains at least one rating, slider, short text, single choice, or checkbox question. A survey built only from Yes / No and long text questions shows no analytics panel at all — and because free-text aggregation lives inside that panel, a comment-only survey shows no free-text aggregation either. Once you save an Analytics Configuration for a survey, the panel switches to an explicit allow-list: only questions with Include in Analytics turned on appear, and that setting defaults to off for each question.Analytics Views
The analytics dashboard includes three tabs. It opens on By Group: Overview Tab- Course-wide statistics with diverging stacked bar charts for Likert-scale questions
- Summary cards showing total responses, response rate, and alerts for groups needing attention
- Filter by lab section or class section to compare subgroups
- Compare multiple surveys in a series to track trends over time
- Free-text response aggregation
- View response distributions and statistics for each student group
- Compare group performance against course averages
- Identify groups with low response rates or concerning feedback
- Drill down into individual group responses with member-level detail
- Shows only groups where you are assigned as the mentor
- Same detailed analytics as the By Group view, focused on your groups
- The tab is present for every staff viewer; it is simply empty if you mentor no groups
- Diverging stacked bar charts for Likert-scale questions
- Distribution charts for choice-based questions
- Statistical summaries (mean, median, min, max, standard deviation)
- Alerts for groups with low response rates or concerning metrics
Configuring Analytics
Use the Analytics Configuration section when creating or editing a survey to customize which questions appear in analytics views and set alert thresholds for group monitoring. Global Alert Thresholds:- Variance Threshold: Standard deviation above which to flag high variance (default: 1.5)
- Non-Response Threshold: Response rate below which to flag groups (default: 80%)
- Toggle Include in Analytics to show/hide the question in analytics views
- Set an Alert Threshold value that triggers warnings when group means exceed/fall below a value
- Choose Alert Direction (above/below mean, or any individual response above/below)
- Add a custom Alert Message to explain the concern
- Mark as Reversed Scale if higher values indicate worse outcomes
Analytics automatically group questions by their scale type (e.g., 1-5 Likert scales) for consistent visualization across related questions.
Group Analytics Details
For surveys linked to group assignments, the By Group tab provides team-level analytics: Group Summary Cards:- Visual cards for each group showing response rates and key metrics
- Color-coded alerts for groups needing attention
- Click any card to view detailed group analytics
- Filter groups by lab section or class section using the dropdown
- “All sections” view shows groups organized by section
- Selection is persisted for your next visit
- Group Member Roster: Shows all group members with submission status (✓ submitted, ✗ not submitted)
- Email Links: Instructor view includes mailto links for students and mentors
- Question-by-Question Breakdown: Responses grouped by question type with charts
- Individual Responses: View each group member’s answers
Survey Series
Link related surveys into a series to track trends over time, such as weekly team collaboration check-ins or recurring course feedback.Creating a Survey Series
- Navigate to Surveys → Manage Series
- Click Create Series
- Enter a series name (e.g., “Weekly Team Collaboration Surveys”)
- Add an optional description
- Click Create Series
Linking Surveys to a Series
When creating or editing a survey:- Select a series from the Link to Series dropdown
- Enter a Week Number to indicate the survey’s position in the series
- Surveys in a series can be compared side-by-side in the analytics view
Managing Series
From the Manage Series page, you can:- Expand a series card to see its surveys, listed as
ordinal. title - Click the pencil icon on a series to open Edit Survey Series, where the ↑ and ↓ buttons reorder its surveys
- Edit the series name and description in that same dialog
- Click the trash icon to delete a series. The browser asks to confirm: “Delete series …? Surveys will be unlinked but not deleted.”
Managing Survey Responses
Viewing Response Dashboard
Click View Responses on any published or closed survey to see the response dashboard and analytics.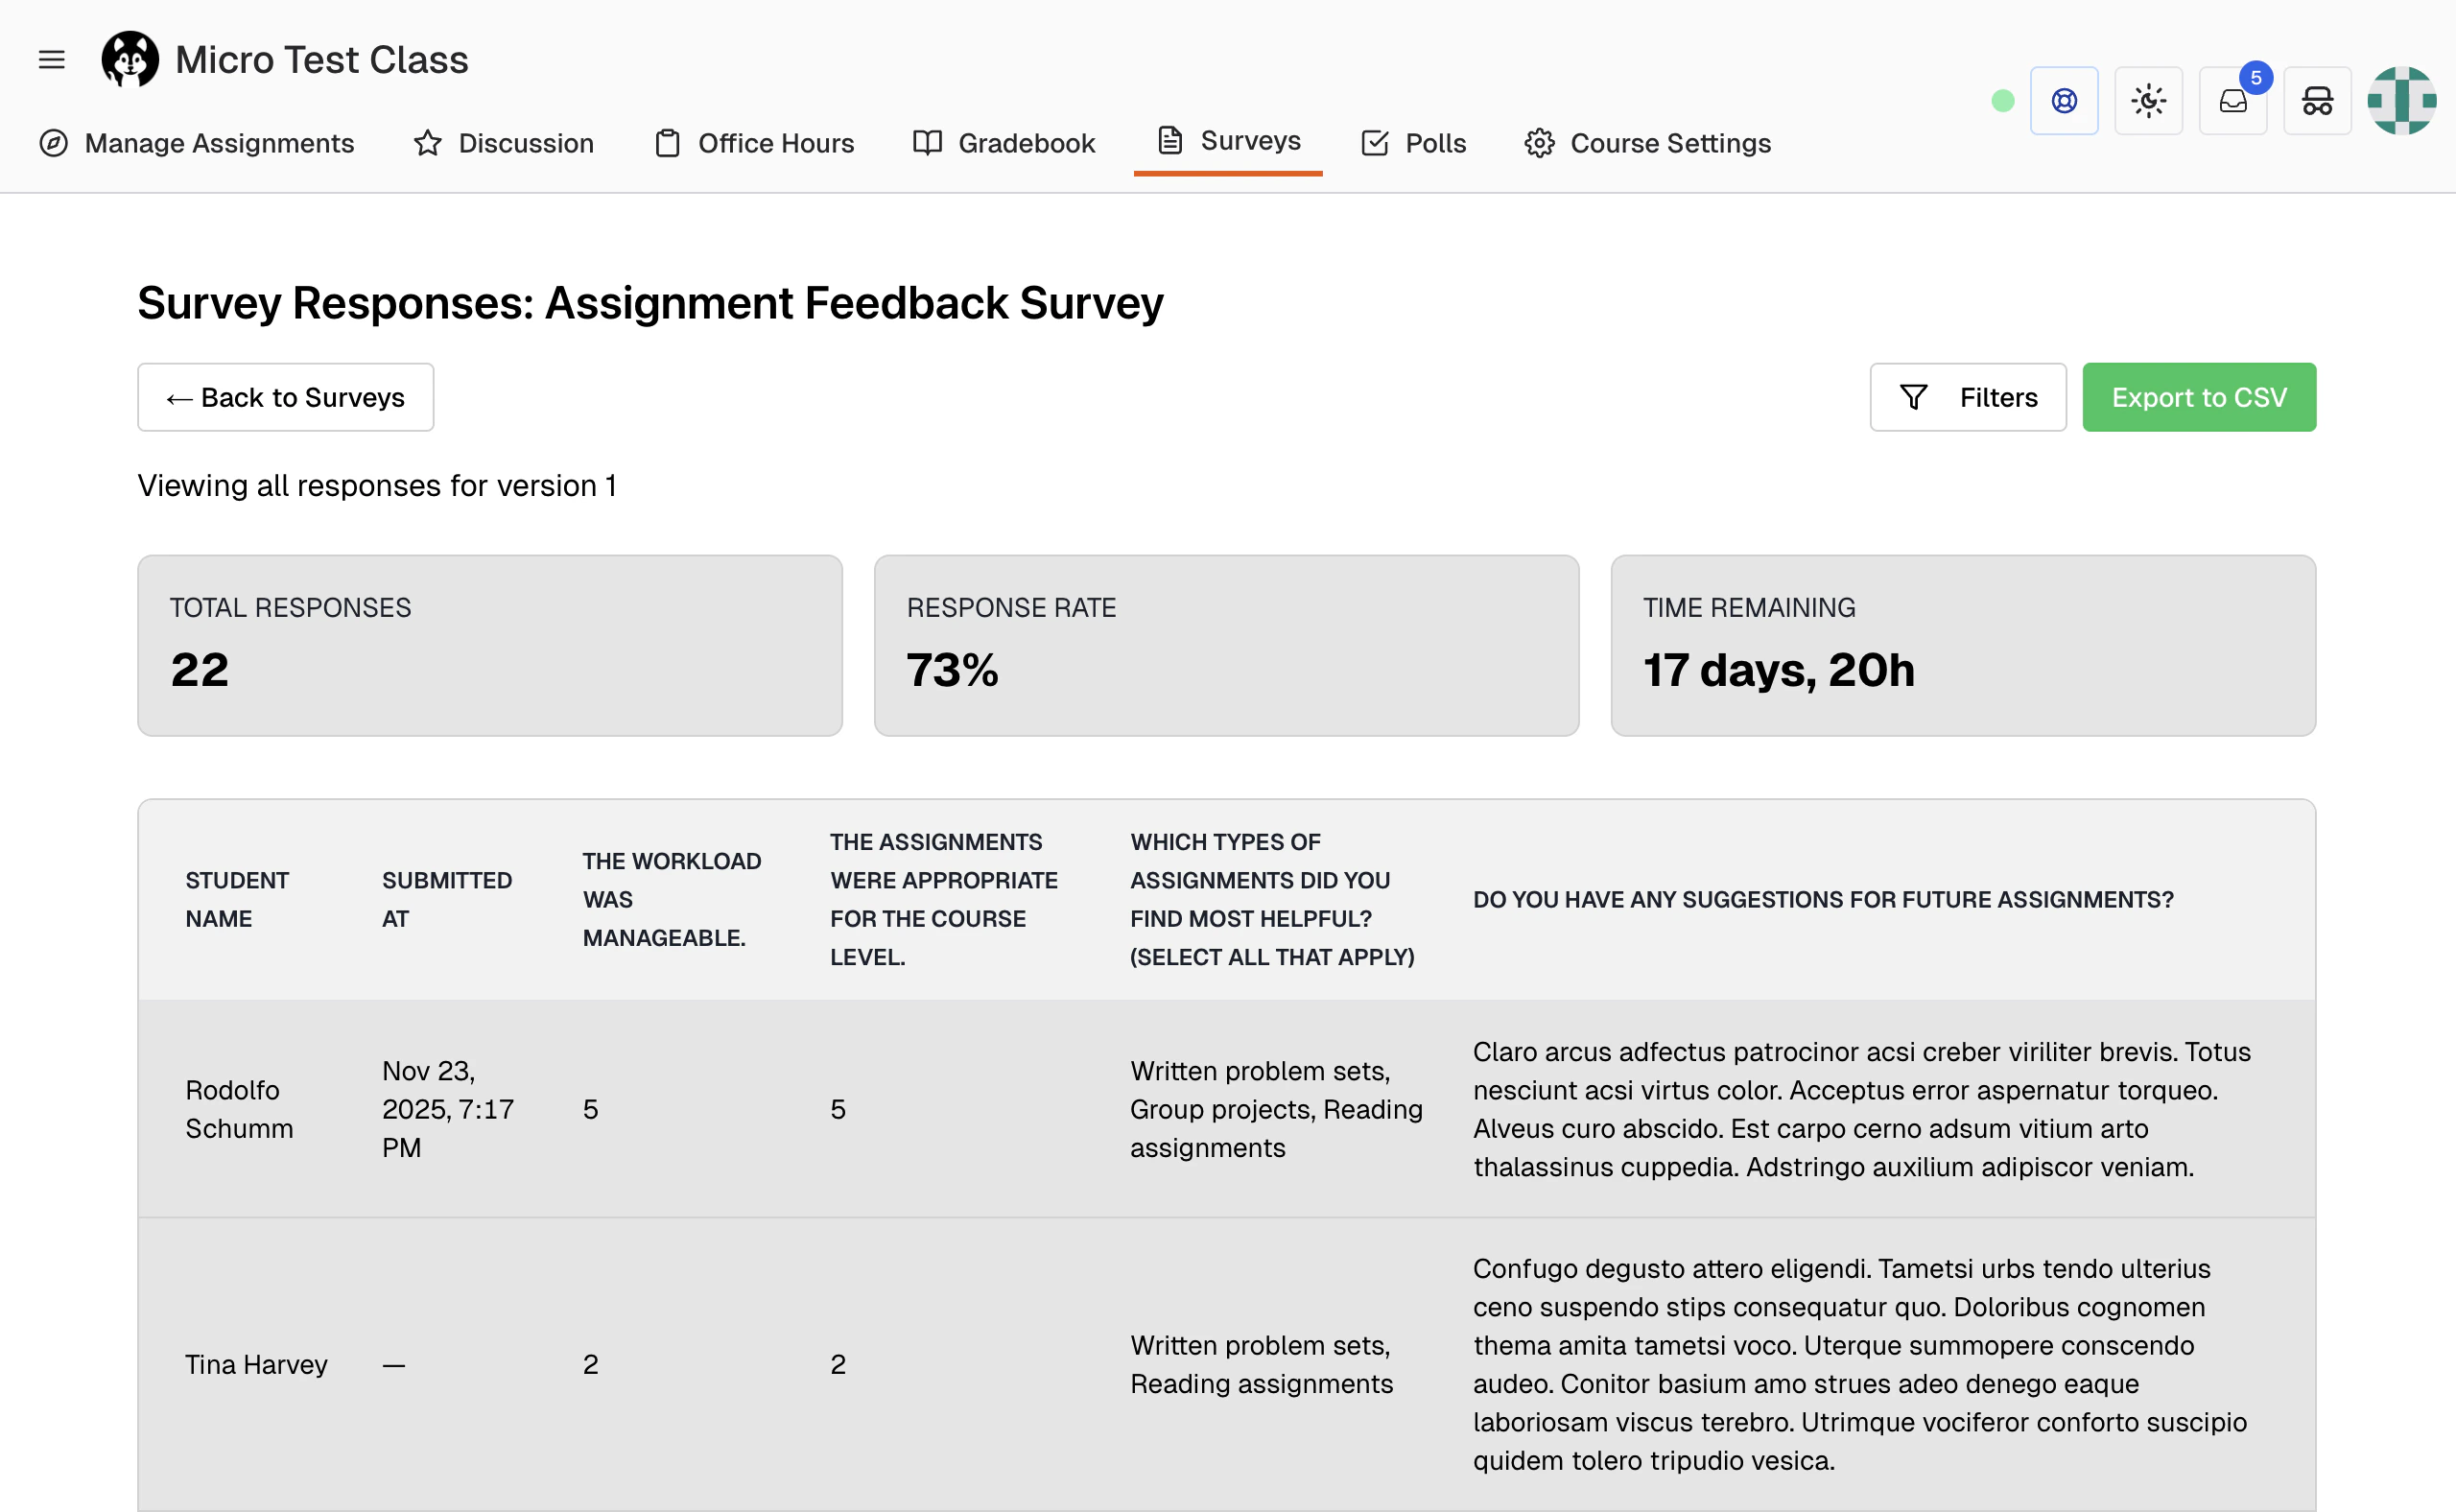
Total Responses
Shows the number of responses currently shown. With a filter active it also shows the unfiltered total, as12 / 30.
Response Rate
Percentage of the students assigned the survey who have responded. Calculated as:Time Remaining
Dynamic countdown to the due date:- Black: More than 24 hours remaining (displays days and hours)
- Orange: Less than 24 hours remaining (displays hours and minutes)
- Red: Past due date (displays “Closed”)
Response Data Table
The table shows all student responses with columns for:- Student name
- Submission timestamp
- Answers to each survey question (dynamic columns)
Filtering Responses
Click the Filters button to open the filter panel with advanced options.Date Range Filter
Filter responses submitted within a specific time period:- Select a start date
- Select an end date
- Only responses submitted between these dates display
- Analyze early vs. late responders
- Track response patterns over time
- Identify submission clusters before deadline
Anonymous Mode
Hide student identifying information for unbiased analysis. Anonymous Mode removes both the Student Name and Submitted At columns from the table.Question Selection Filter
Display only specific questions of interest:- Check/uncheck questions to show or hide
- Reduces information overload for large surveys
- Focus on specific topics or concerns
Exporting Response Data
Click Export to CSV to download response data for external analysis. The export covers the rows left by the date-range filter; the question-selection filter does not narrow it, so every question is always included as a column. CSV Format:- Properly escaped values for Excel/Google Sheets compatibility
- Filename includes survey title and export date, as
survey-responses-<title>-<YYYY-MM-DD>.csv
Viewing Individual Responses
Read one student’s answers from the response table, or from the CSV export if you want them alongside everyone else’s.Editing Surveys
Editing Draft Surveys
Draft surveys can be edited freely with no restrictions:- Click the draft’s title, or choose Edit from its ⋯ menu
- Modify title, description, questions, or settings
- Save changes and continue working
- No student impact since draft surveys are not visible
Editing Published Surveys
On a published survey, the ⋯ menu item is labelled Edit (New Version), and the dashboard shows a version badge next to each survey. What You Can Safely Edit:- Survey title (won’t affect existing responses)
- Description (provides context for future responders)
- Due date (can extend deadline if needed)
- Allow response editing setting
- Survey questions (may invalidate existing responses)
- Question types (data type mismatch with existing responses)
- Removing questions (orphans existing response data)
Validation and Error Handling
The system validates surveys before publishing:- Ensures due date is in the future (cannot publish with past due date)
- Validates JSON structure of survey questions
- Checks for required fields (title, question structure)
Saving Survey Templates
Share your successful survey designs with others or reuse them in future semesters:- Open a survey in the editor, or fill out the new-survey form
- Click Add to Template Library at the bottom of the form (the form must be valid)
- Choose template scope:
- Course Only: Available only in your course
- Global (Shared): Available to all instructors across courses
Deleting Surveys
Deleting a survey is a soft delete. To remove a survey from your course:- Open the survey’s ⋯ menu and choose Delete
- Your browser asks you to confirm. For a survey that already has responses, the message reads: “This survey has N response(s). Deleting it will hide the survey from view but preserve all response data for record keeping. This action can be undone by restoring the survey.” For a draft or a survey with no responses, it just asks “Are you sure you want to delete …?”
- Accept the browser’s confirmation to delete the survey