Poll Visualizations
Pawtograder provides real-time visualizations for poll results, making it easy to share results with your class during a lecture.Response Dashboard
After creating a poll, you can view results in real-time. The response dashboard includes: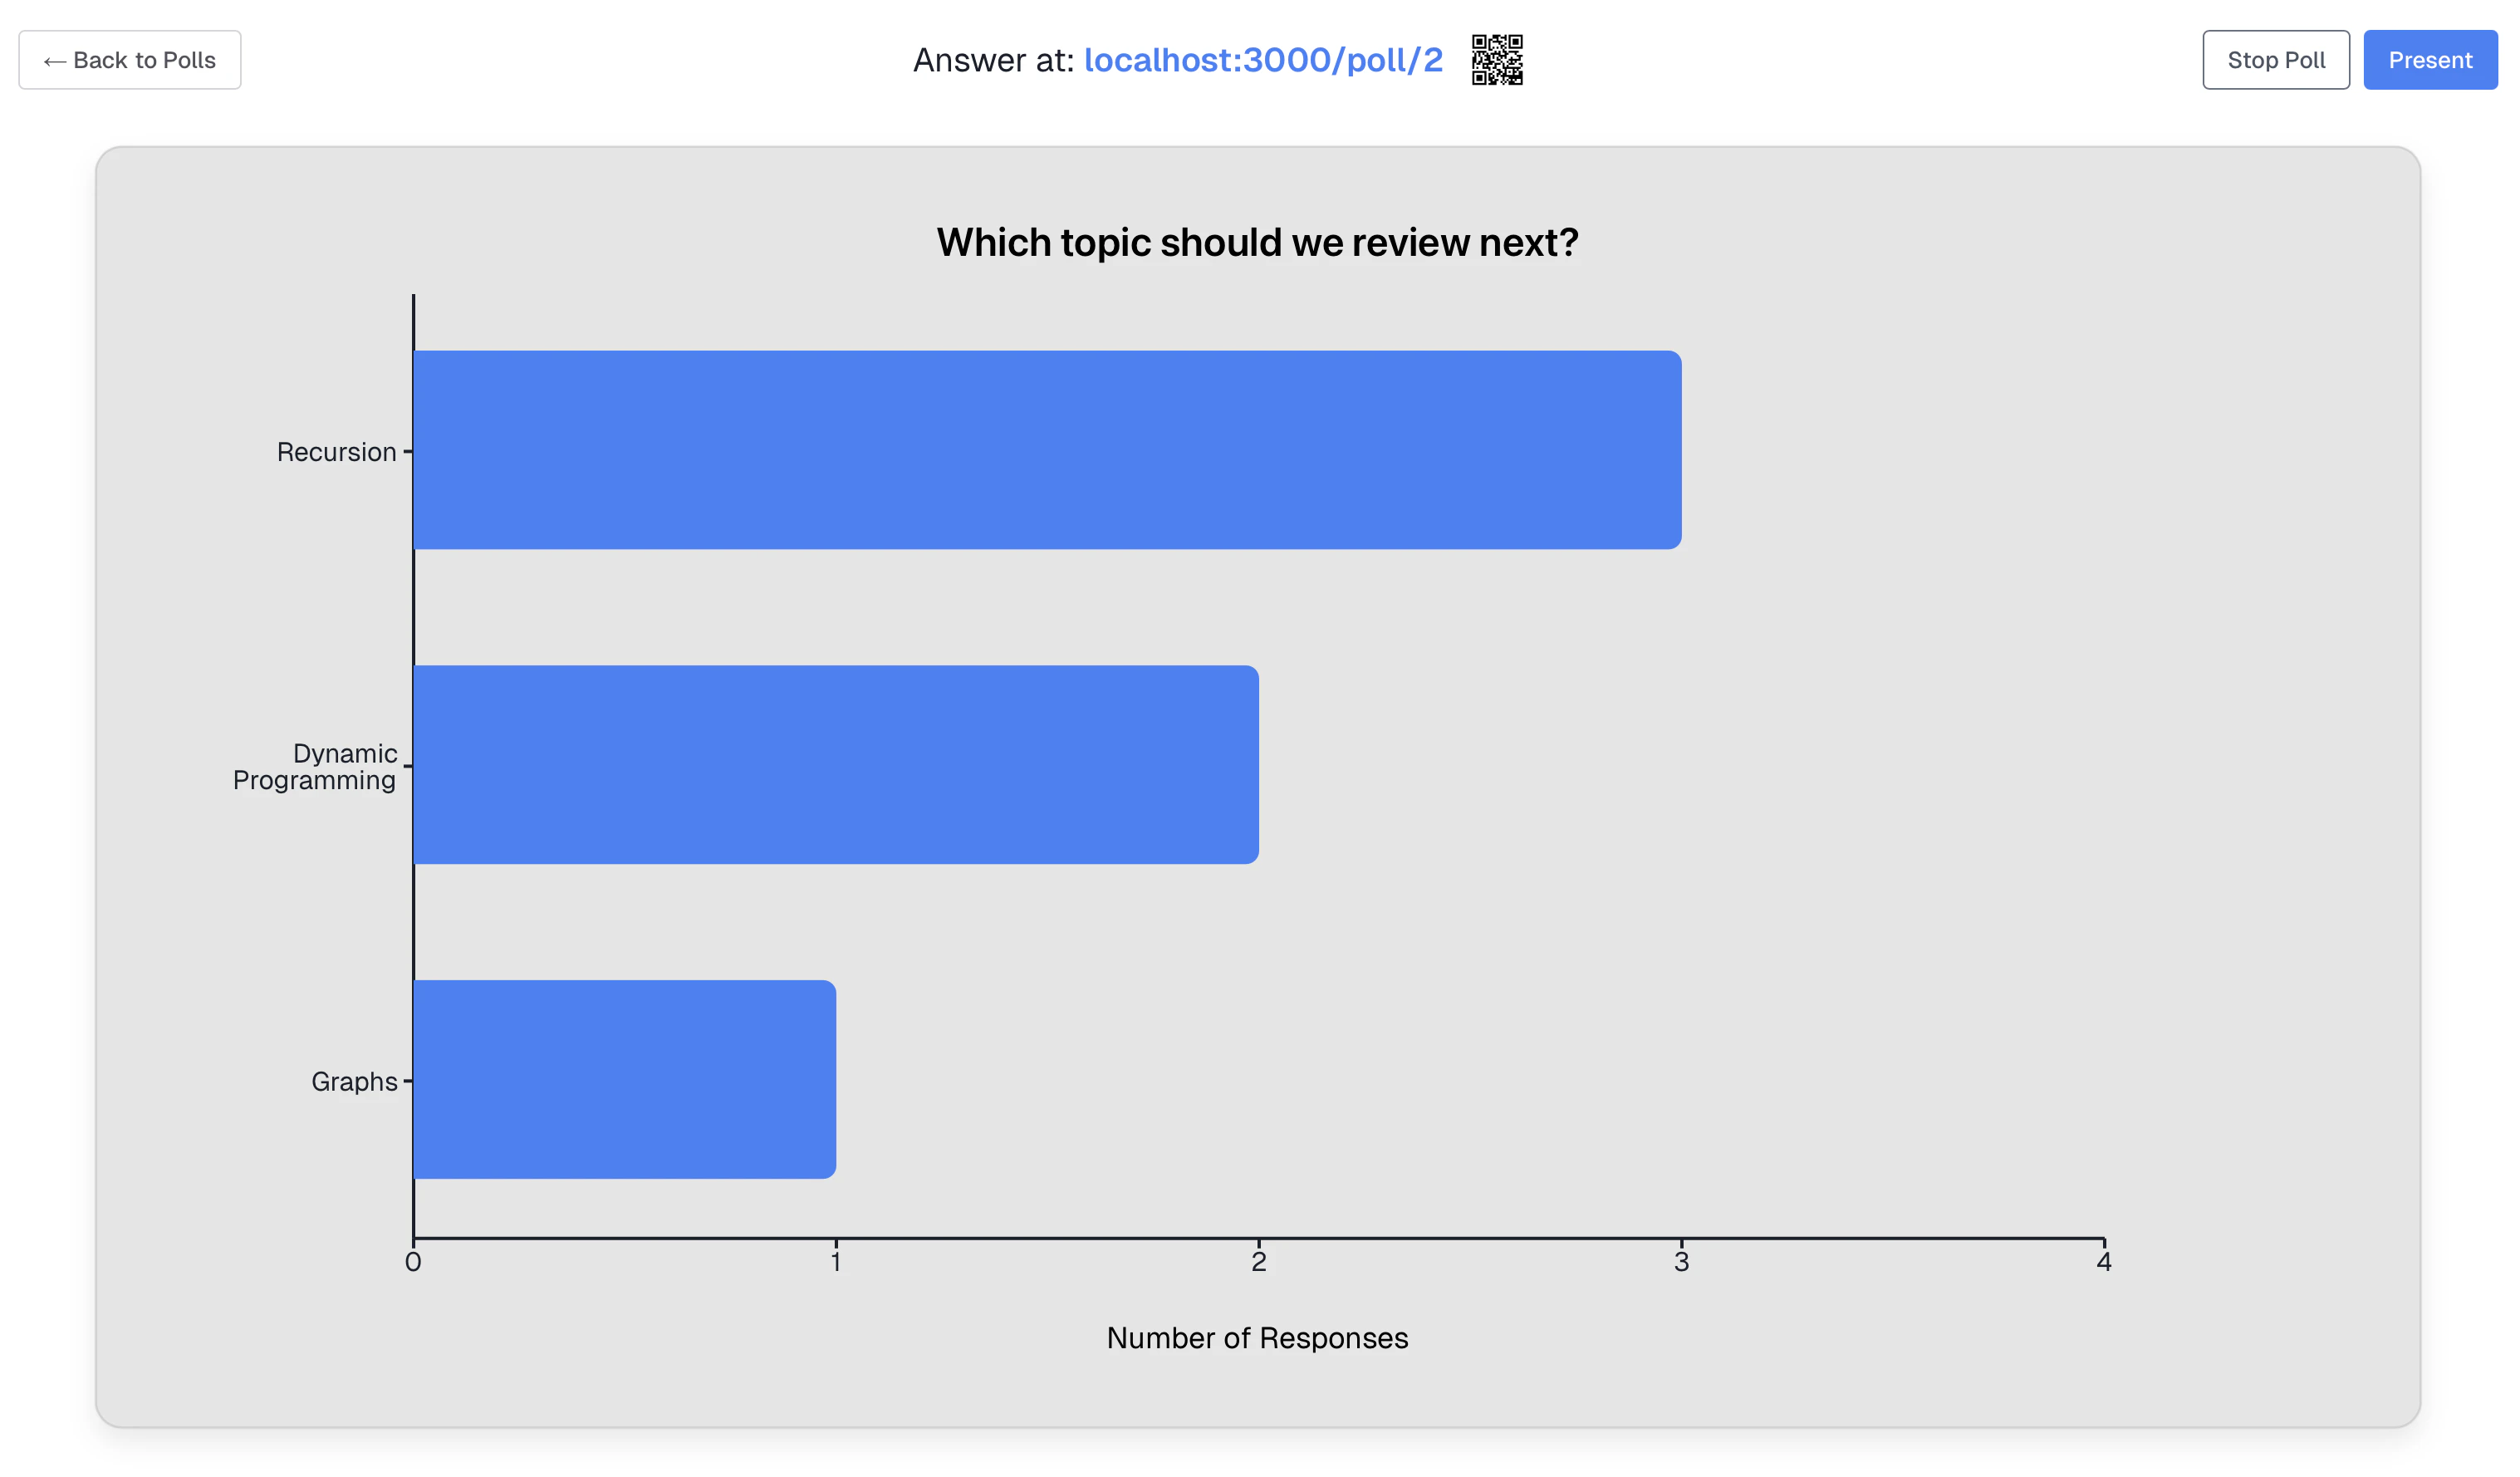
Dashboard Components
| Component | Description |
|---|---|
| Header | Shows poll question, URL, QR code, and controls |
| Bar Chart | Visual representation of response distribution |
| Response Count | Total number of responses received |
| Poll URL | Direct link students can use to respond |
| QR Code | Scannable code for quick mobile access |
Real-Time Updates
The dashboard updates instantly as students submit responses:- No page refresh required
- Bar lengths animate as new responses come in
- Response counts update in real-time
- Works across all connected instructor devices
Real-time updates are powered by Supabase’s realtime subscriptions. The dashboard subscribes to response changes and updates the UI immediately when new data arrives.
Bar Chart Visualization
Both single choice and multiple choice polls display results as a horizontal bar chart:- Each answer option is shown as a separate bar
- Bar length corresponds to the number of responses for that option
- Labels show the option text
- Counts display the number of responses per option
- Colors distinguish between different options
Reading the Chart
For Single Choice polls:- The total responses equals the sum of all bars
- Percentages will total 100%
- Each bar shows how many students selected that option
- Percentages may exceed 100% (students can select multiple)
- Total responses shows unique students who responded
QR Code Access
Each poll has a unique QR code that allows students to quickly access and respond from their mobile devices.How QR Codes Work
| Feature | Behavior |
|---|---|
| Class-Specific | The QR code links to your specific course |
| Latest Poll | Always directs to the newest active poll |
| Click to Enlarge | Click the QR code to view it in a larger modal |
Using the QR Code in Class
- Create and publish a new poll
- Navigate to the poll’s response dashboard
- Click the QR code to enlarge it for projection
- Students scan with their phone camera
- They’re directed to the current poll and can submit their response
If the poll has Require Login enabled, students will be prompted to log in before they can submit a response.
Presentation Mode
Presentation mode provides a fullscreen display optimized for classroom projection.Entering Presentation Mode
- Open the poll response dashboard
- Click the Present button in the header
- The chart expands to fill the entire screen
- QR code appears in the bottom-right corner for student access
Presentation Mode Features
- Fullscreen Display: Chart fills the entire screen
- Large QR Code: Easy to scan from anywhere in the classroom
- Poll URL: Displayed at the bottom for manual entry
- Real-Time Updates: Chart continues to update live
- Dark Background: Optimized for projection visibility
Exiting Presentation Mode
- Press the Escape key
- Click the Close button (if visible)
Poll Controls
The response dashboard header includes controls for managing the poll:Start/Stop Poll
-
Start Poll: Makes a closed poll live again
- Resets the 1-hour auto-close timer
- Students can begin submitting responses
- Real-time updates activate
-
Stop Poll: Closes an active poll
- Stops accepting new responses
- Existing responses are preserved
- Results remain viewable
Poll URL
The poll URL is displayed in the header and can be:- Copied and shared via chat, email, or LMS
- Projected for students to type manually
- Posted on a class website
https://pawtograder.com/poll/{course_id}
Tips for Effective Presentation
Before Projecting
- Test the QR code from different distances
- Ensure the projector resolution shows the chart clearly
- Have a backup plan (URL) if QR scanning fails
During Class
- Allow 30-60 seconds for students to respond
- Watch the response count to know when most students have answered
- Use presentation mode when you want all eyes on the results
Discussing Results
- Point out the most popular answers
- Ask students to explain their reasoning
- Use surprising results to spark discussion
Accessibility Considerations
- Bar charts use distinct colors for each option
- Option labels are displayed as text alongside bars
- Response counts are shown numerically
- QR code has sufficient contrast for scanning
- Poll URL provides text-based alternative to QR code