

Workflow Runs
Course Settings → Workflow Runs is where you look when autograding stops behaving. It reports the GitHub Actions runs that Pawtograder has seen on the course’s student repositories, how long they queued and ran, and the grading errors those runs produced. The entry is instructor-only, and its route ismanage/workflow-runs. Unlike
almost every other Course Settings entry, it does not sit under manage/course/.
Three tabs
A sidebar on the left of the Workflow Management wrapper switches between:
On a narrow screen the sidebar collapses into a Select workflow page dropdown.
A run is not a submission, and not a grader result
These three are separate records, and confusing them is the main way this page gets misread. A workflow run is one execution of one GitHub Actions workflow on one repository. Pawtograder records it from GitHub’s webhook and keys it by run ID, attempt number and course. Any workflow in a student repository is recorded, not only the autograder, so a repository with its own CI will show runs here that have nothing to do with grading. Runs on repositories Pawtograder does not track, such as handout and solution repositories, are never attributed to a course and never appear. A submission is the graded artifact inside Pawtograder. A grader result is the score attached to a submission. A workflow run can finish without producing either, and that gap is exactly what the Grading Errors tab exists to surface. TheStudent and Assignment values on a run come from the repository the run
belongs to, not from the run itself. A group repository identifies a group rather
than a single profile, so its runs show a dash in Student.
Overview
Five cards cover Last hour, Today, This week, This month and All time. Each showsTotal Runs, Errors, Avg Queue Time and Avg Run Time,
plus an Error Rate once there is at least one run. The two timing figures change
color as they grow: queue time turns orange above one minute and red above five,
and run time turns orange above two minutes and red above ten.
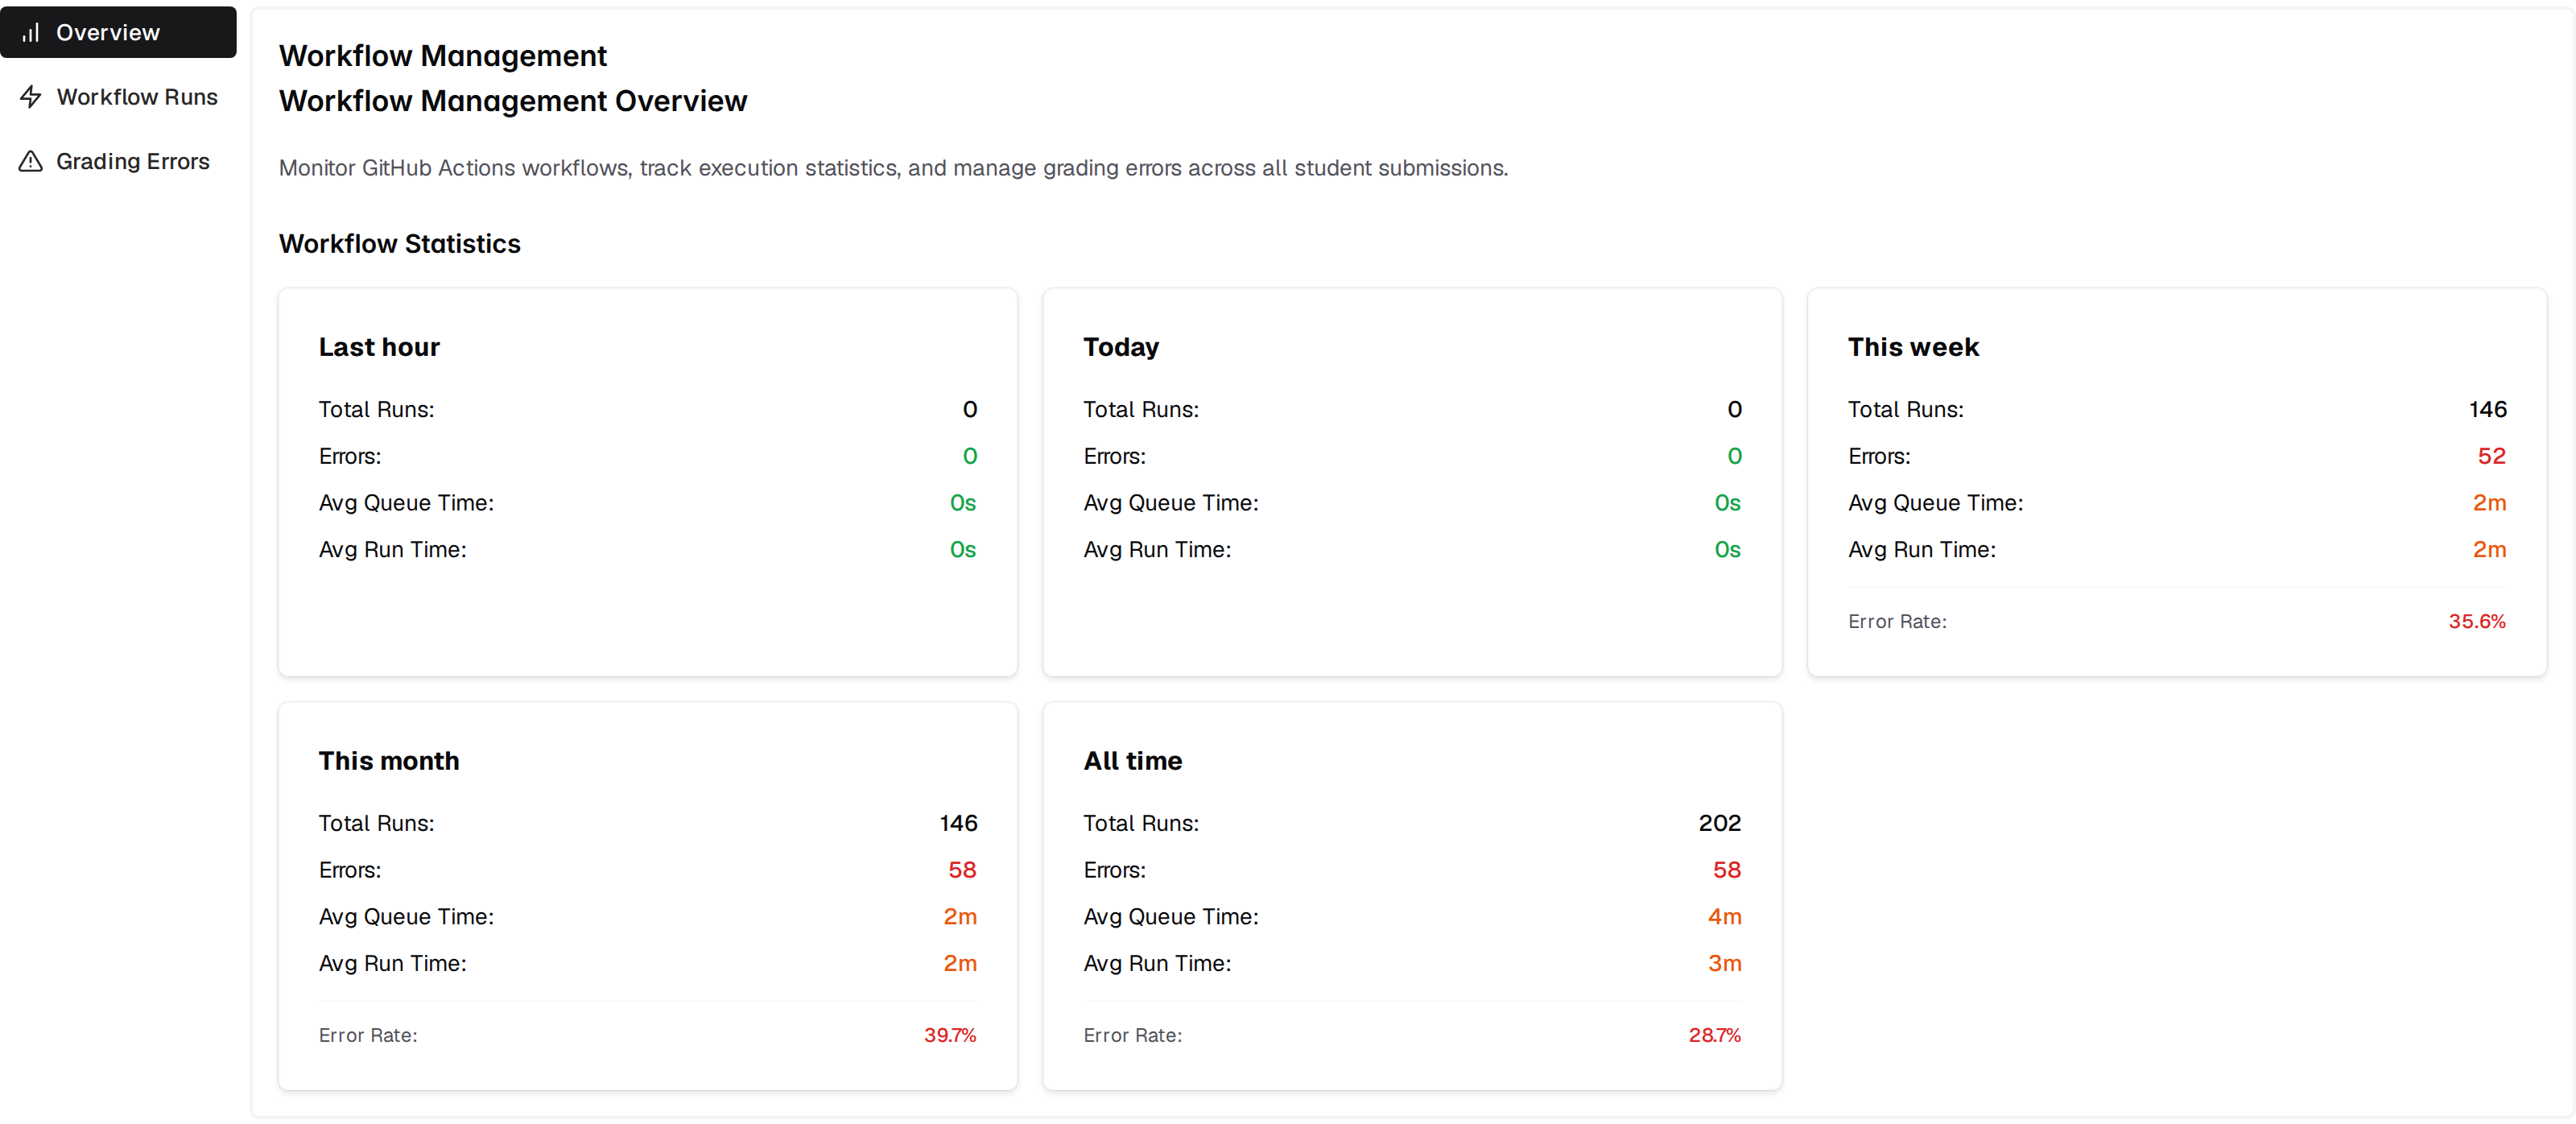
The statistics window is clamped to six months, so All time means the last six
months.
The Workflow Runs tab
This tab lists the 1000 most recently requested runs for the course, newest first. It updates in real time, and the refresh button in the top-right corner reloads it on demand. The count under the table readsN Workflow Runs Total.
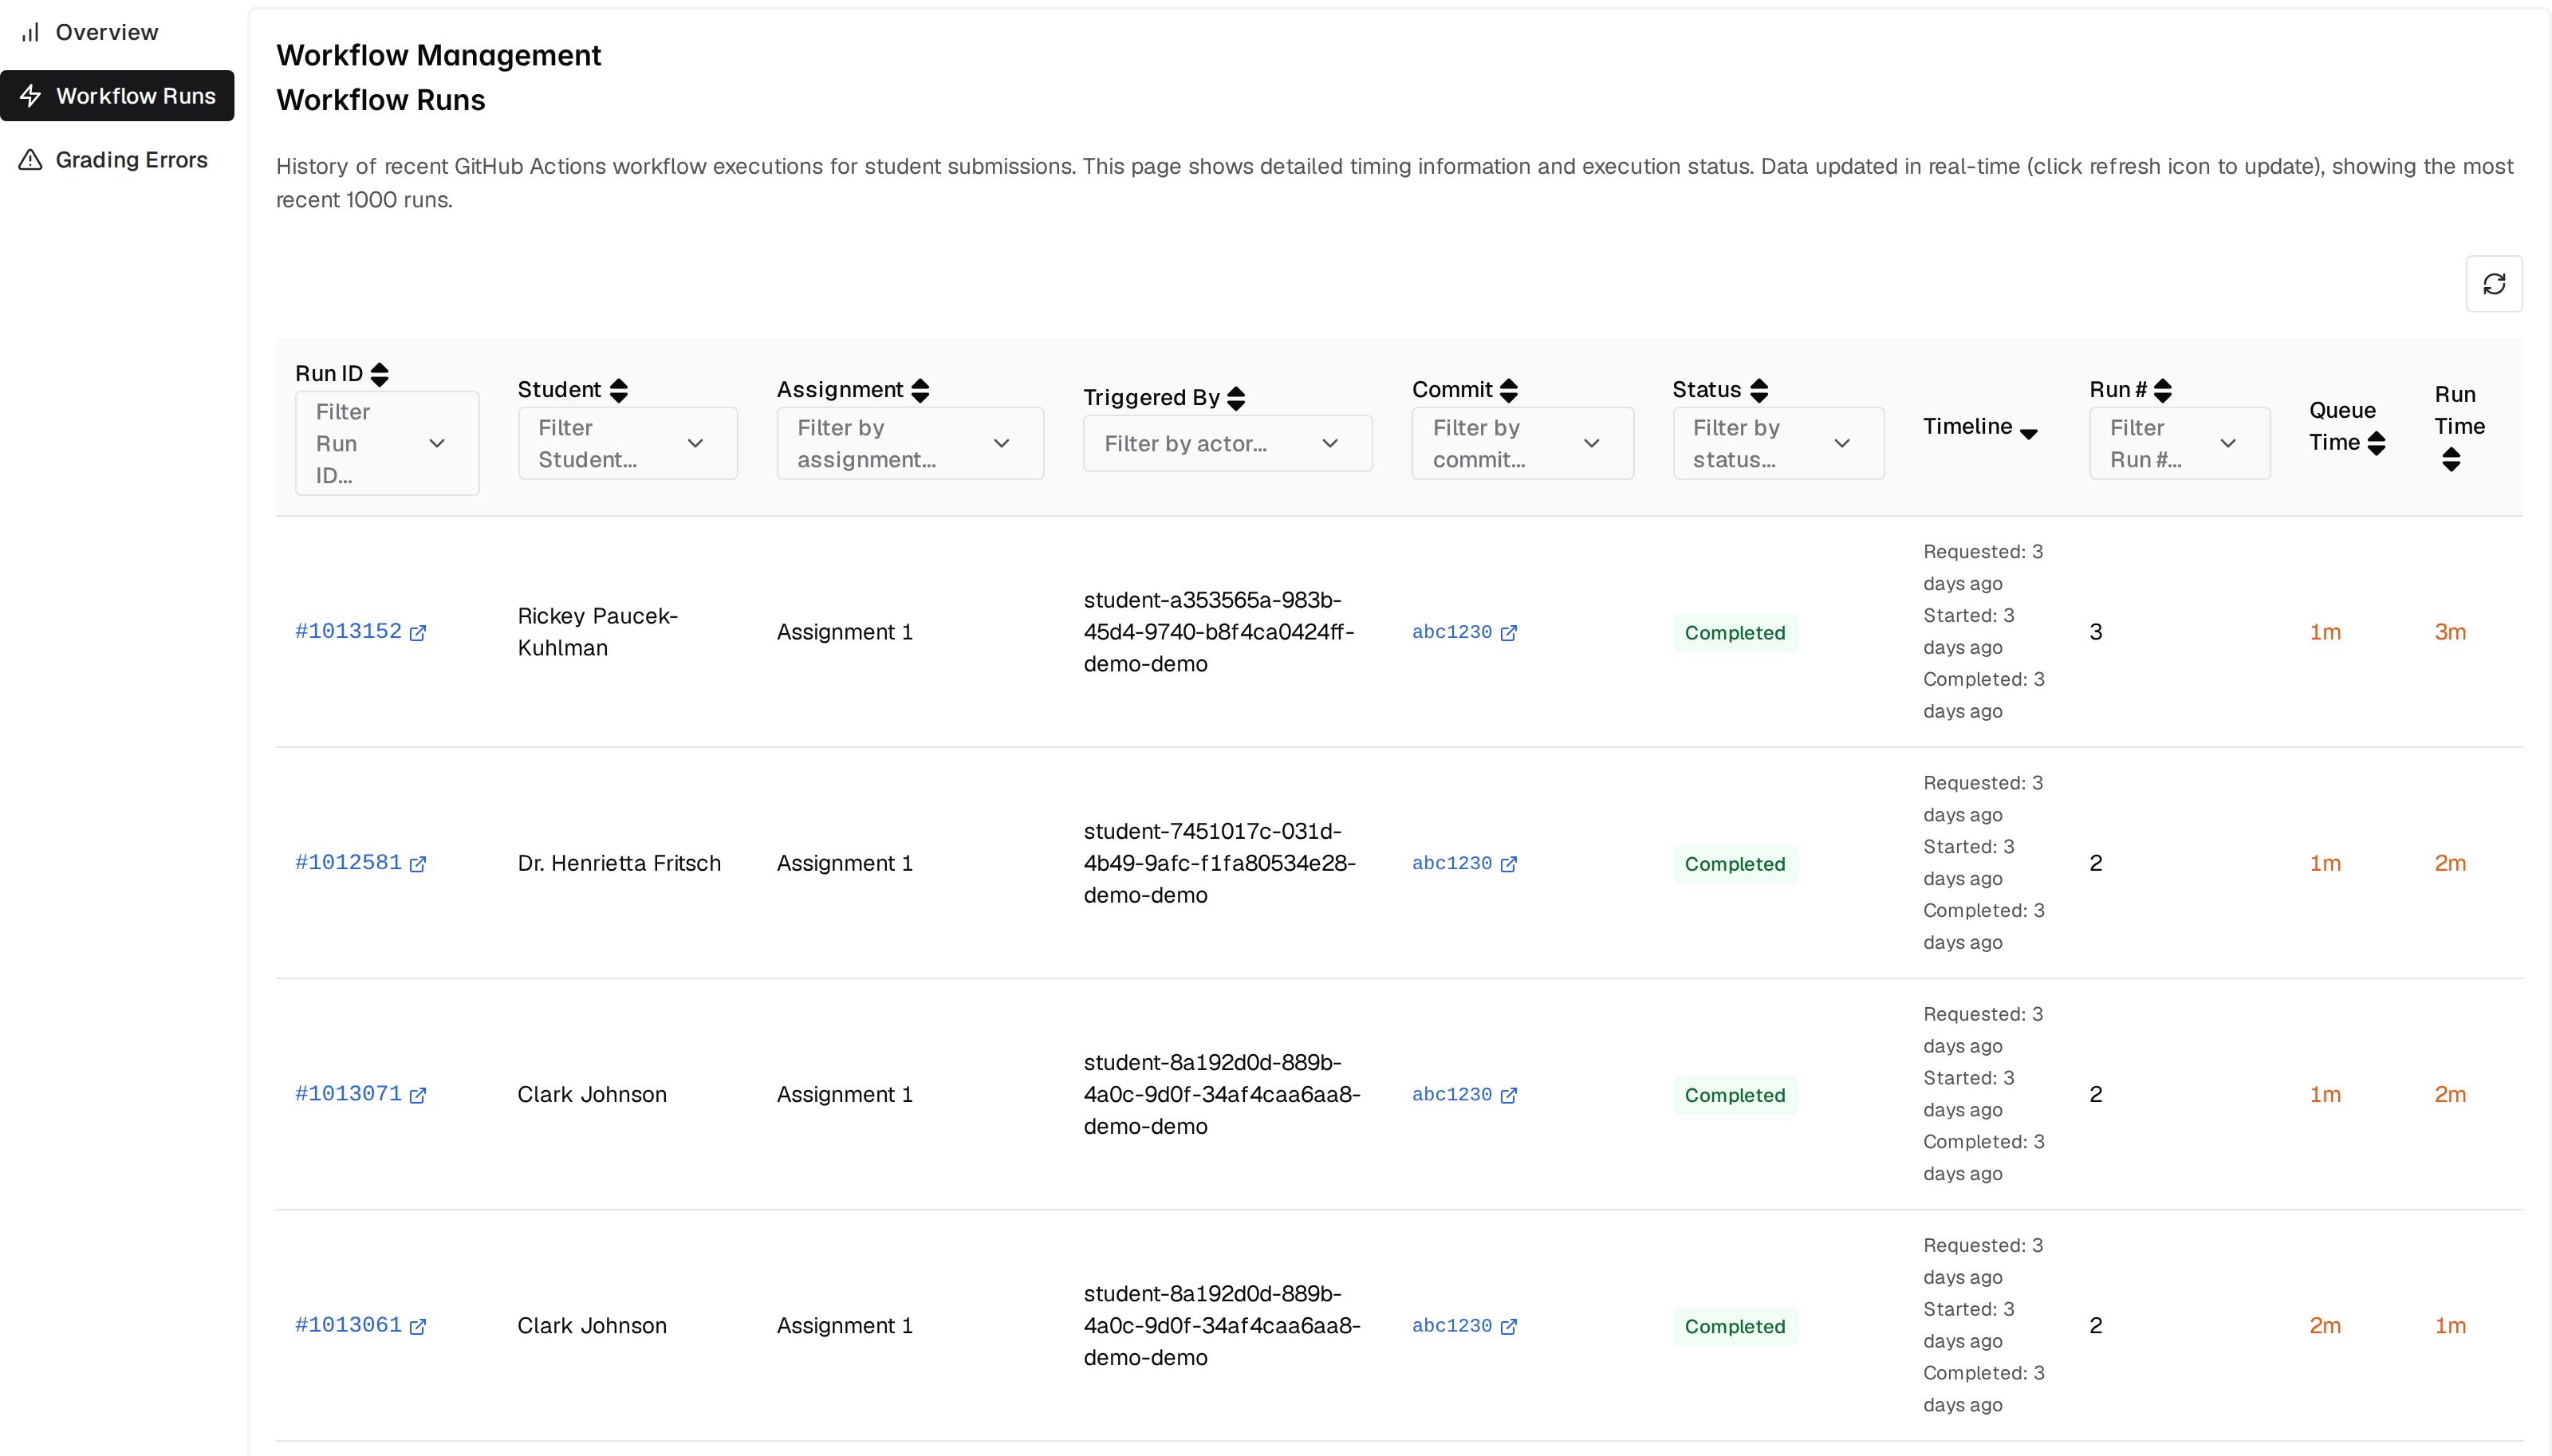
Every column except
Timeline, Queue Time and Run Time has a multi-select
filter in its header, so you can narrow to one student, one assignment, one commit
or one status.
Because rows are built from webhook deliveries, a run that GitHub never reported
as completed sits at In Progress indefinitely rather than moving to a failure
state.
The Grading Errors tab
This tab is the failure view. Each row is one recorded grading error, newest first, and when there are none the tab says so.Type comes from the error record, and the filter offers User Visible Error,
Security Error, Config Error and Unknown. Visibility says whether the student
can read the error: a public error is visible to the student on their own
submission, while a private one is staff-only. Errors raised by a security check
or by an unexpected internal failure are recorded as private. Instructors and
graders see every error either way.
Clear All Filters resets the header filters, and the text beside it reads
Showing X of Y errors, where X is the number of error rows on the page you are
looking at and Y is the size of the whole filtered result set.
What a failed run means, and what you can do
The case you will meet most often is a run that finished without producing a grader result. When that happens Pawtograder records an error reading “The grading container failed to terminate cleanly. This may indicate that the grading script ran out of memory or encountered an unexpected error. Please contact your instructor for assistance.”, and writes a grader result with a score of zero so the submission is not left blank. The student sees that message, because it is a public error on their own submission. From a row on the Grading Errors tab you can:- Open the run on GitHub through the
CIlink and read the Actions log, which is where the real cause lives. - Open the affected submission through the
Submissionlink. - Open the repository or the exact commit through the
Repositorylink.
Where the runs come from
The autograder is a workflow file,.github/workflows/grade.yml, that lives in
each student repository. Pushes to that repository trigger it according to its own
on: block, and the run it starts is what shows up on this page. See
Autograding for how the
workflow is triggered and what it does.
Because each student repository holds its own copy, a repository whose copy is
missing or out of date behaves differently from the rest of the class. The CLI’s
repos sync-grade-workflow pushes the
handout’s copy to student repositories in bulk.
Who can see it
The Course Settings entry is instructor-only, so graders do not see Workflow Runs in their menu. Access behind that menu is not uniform, though: the list of individual runs is visible to instructors only, while grading errors and the statistics behind the Overview are visible to graders as well. A grader who opens the URL directly gets an Overview and a Grading Errors tab that work, and a Workflow Runs tab with nothing in it. See Course Settings for the rest of the menu’s visibility rules.The dashboard summary
The instructor dashboard carries a Workflow Runs Summary block that is a condensed version of the Overview. Two cards, Last Hour and Last 24 Hours, each showTotal Runs, Avg Queue Time, Avg Run Time and Error Rate, with a
badge giving the period’s error count, and both card titles link here.
Underneath, when either window has errors, a Recent Errors card lists the five
newest errors in the course with the error name, when it happened, and the student
or group and assignment it belongs to. Its View All badge opens the Grading
Errors tab. When both windows are clean, that card is replaced by a single line
confirming no errors in the last 24 hours. See
Instructor Dashboard for the
rest of the dashboard.