

Assignment Dashboard
Dashboard is a tab on an assignment’s home page. It summarizes grading progress and score distributions for that one assignment, and hosts the submissions table.Accessing the Dashboard
Opening an assignment from the course’s assignments list lands you on Assignment Home, the first link in the left Assignment management sidebar. Assignment Home has two tabs: Dashboard and Grading assigned to me. Dashboard opens by default, unless you have submissions assigned to you for grading, in which case Grading assigned to me opens first. Above the tabs, the page header lists the assignment’s Released and Due dates, its Handout repo, and its Grader repo. Courses with the suggested due date feature flag enabled also see a Suggested due date, on assignments that have one — the pattern used for mastery or standards grading.For a course-wide view across every assignment, use the
Instructor Dashboard instead. There is no
course-level assignment dashboard.
Dashboard components
The tab renders four blocks, in this order.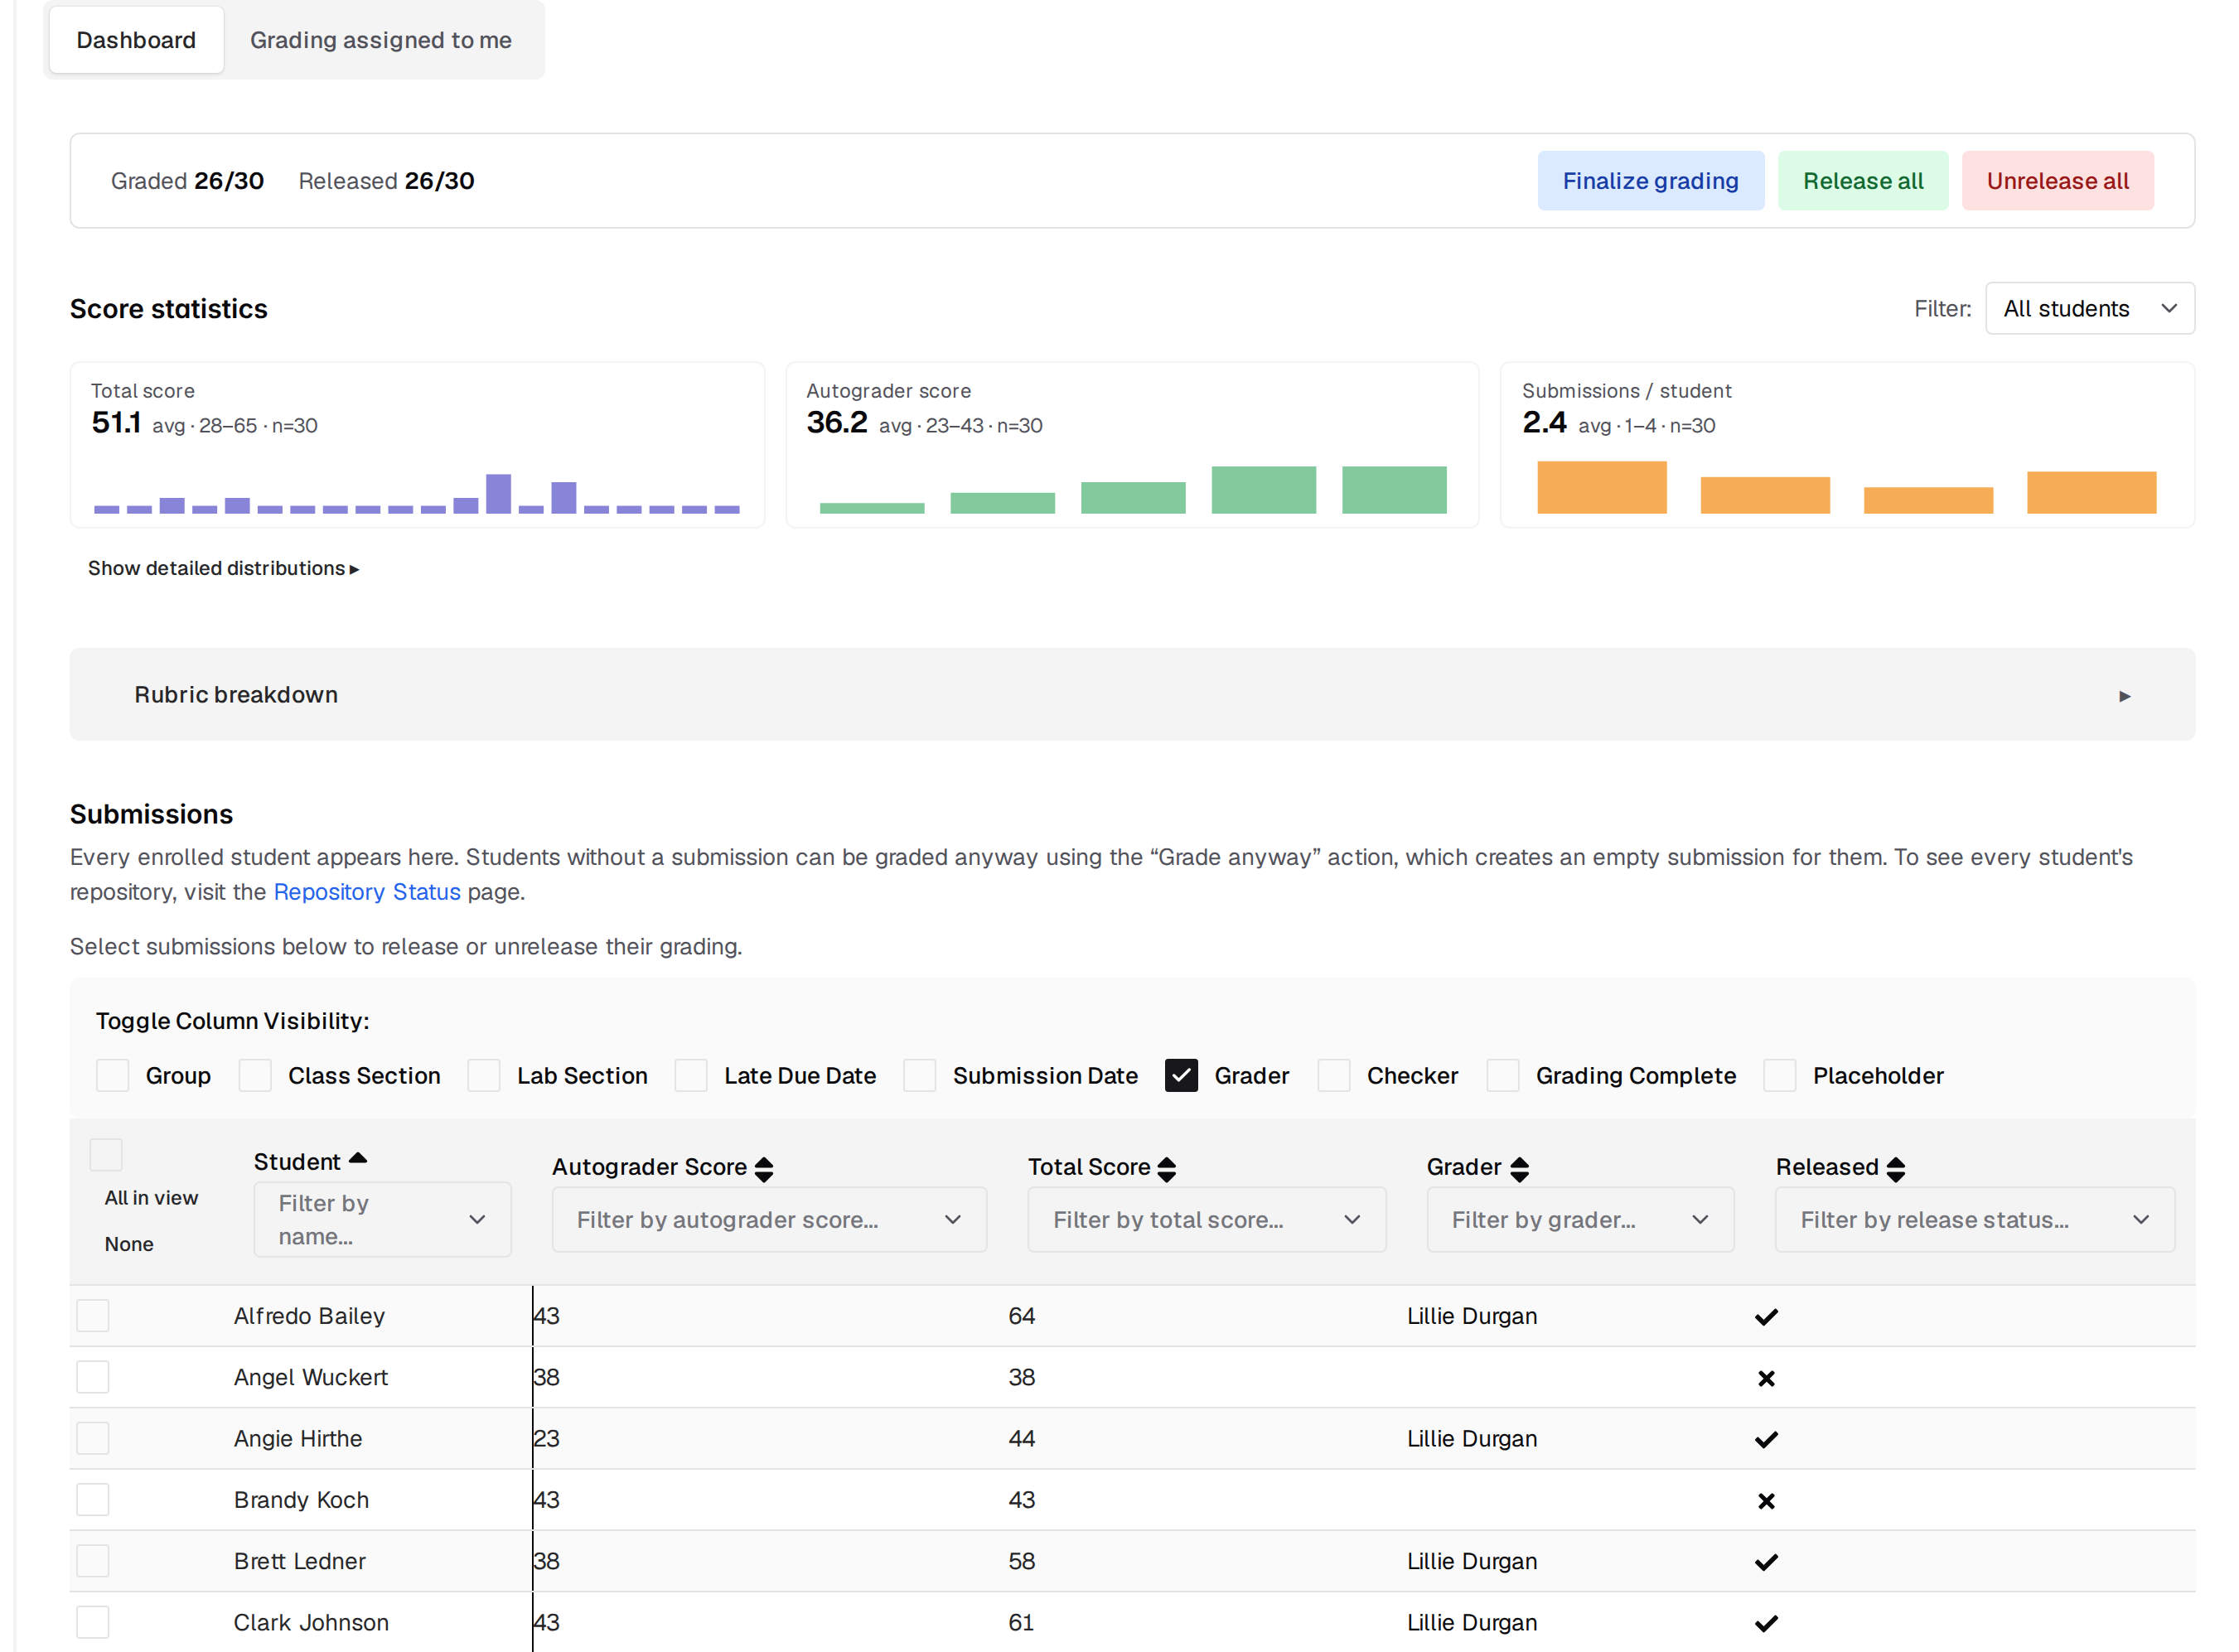
Grading status
A single card with three counts — Graded, Released, and Not submitted (shown only when some enrolled students have no active submission) — followed by the assignment-level grading actions:- Finalize grading marks every eligible submission review complete, meaning those whose required rubric checks are all applied. It does not release grades.
- Release all and Unrelease all publish or hide grades for every submission in the assignment. Both are instructor-only, both ask for confirmation, and neither affects self-review or meta-grading rounds.
Score statistics
Three tiles — Total score, Autograder score, and Submissions / student — each showing the average, the min–max range, how many values went into it, and a sparkline of the distribution. Submissions with no score for a measure are left out of that measure’s statistics. A Filter dropdown narrows the statistics to a single class section or lab section; it defaults to All students. Show detailed distributions expands each tile into Min / Average / Max / Graded readouts and adds a full histogram per measure.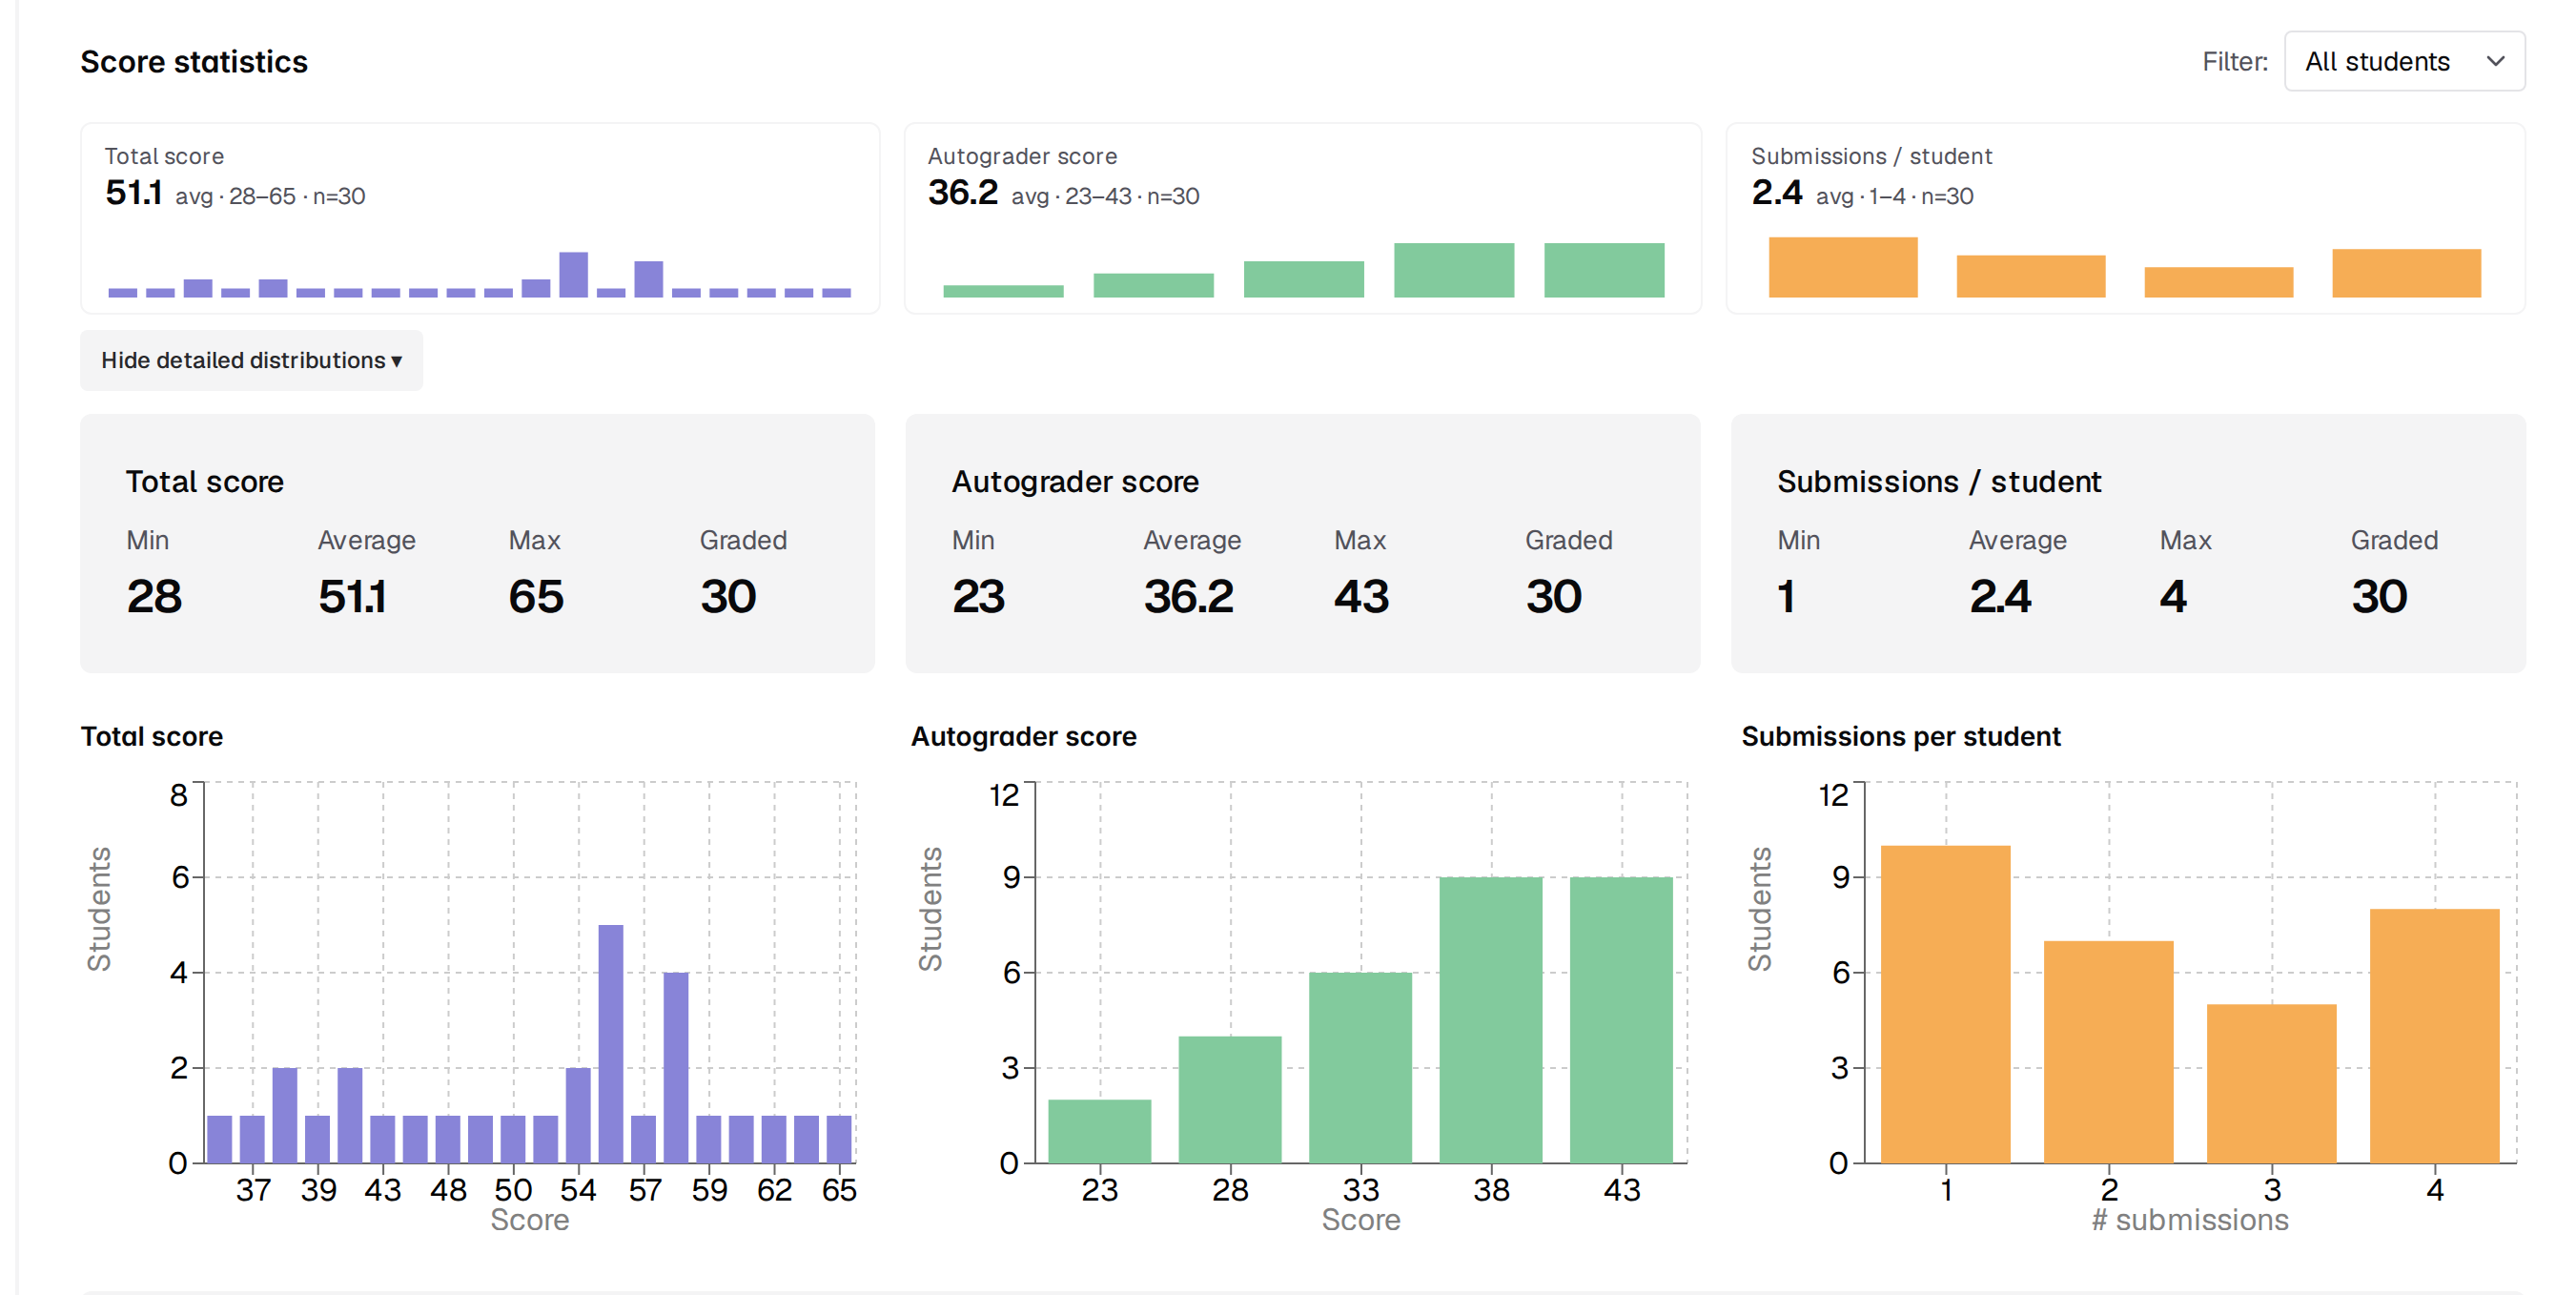
Rubric breakdown
A collapsed section that loads its data only when you open it. It reports how often each rubric check was applied, in a Criterion / Check / Applied / % table. Clicking a row filters the submissions table below to the students that check was applied to; Clear filter removes the filter again.Submissions
The submissions table, listing every enrolled student, not only those who submitted. Students without a submission can still be graded using the Grade anyway action, which creates a placeholder submission for them. Most column headers both sort and filter. Toggle Column Visibility above the table shows or hides the Group, Class Section, Lab Section, Late Due Date, Submission Date, Grader, Checker, Grading Complete, and Placeholder columns. Selecting rows reveals Release N selected submissions and Unrelease N selected submissions for instructors. As with Release all, releasing a selection that contains incomplete reviews prompts for confirmation first. There is no bulk mark-complete action; Finalize grading is the only way to complete reviews in bulk, and it covers the whole assignment.Exporting data
The assignment header carries two instructor-only controls:- Export Grades opens a popover with checkboxes for Include Score Breakdown, Include Rubric Checks, Include Autograder Test Results, Include Repo Metadata, and Include Submission Metadata, then exports as CSV or JSON.
- Download All Submissions builds a ZIP with one folder per student holding that student’s active submission files. Students with no active submission, or with no files recorded, get a placeholder text file instead.
Related pages
- Grading Status: per-grader progress and workload
- Grading Assignments: assigning submissions to graders
- Security Dashboard: academic integrity monitoring
- Test Insights: autograder test performance and common errors